Upcoming Turnaround In Mining Stocks
The price of no asset can move up or down in a straight line, so why should mining stocks be any different? They have been declining relentlessly for almost 2 weeks, erasing more than 10% of their value. Sharp? Definitely. Unsustainable? Perhaps. When will the turnaround take place? It depends.
It depends on the bullish signs and confirmations that we get. The correct question to be asking now is: “Why do we need any confirmations at all?” The reply is that because the situation is tense as there are good reasons for both a turnaround in a day or two and a continuation of the decline without a meaningful correction.
Before moving to the above details, we would like to give you an update on the gold-stock link. Let’s start with gold’s price compared to the S&P 500 Index (charts courtesy of http://stockcharts.com).
As we explained previously, there’s one thing that – right from the start – differentiates between the two kinds of reaction: stocks declining along with gold and stocks triggering a rally in gold. Autocorrelation. Autocorrelation is a fancy way of saying that what happens first makes the same reaction likely, which makes the follow-up to the follow-up likely to be the same as well – and so on. In other words, the way gold initially reacted to the decline in the S&P 500 was the way in which it kept on reacting in the following weeks and – sometimes – months.
What kind of price action did we see in the previous several days (not only yesterday)? On average, the S&P declined along with gold. So, what’s the likely impact that a declining stock market is going to have on the precious metals market? It’s likely going to be negative in the following weeks and – perhaps – months.
At this point you may correctly ask: “If that’s the case, then why didn’t gold decline on Monday?” There are several reasons as to why this was not the case.
The simplest one is that the relationship described in the previous paragraph is supposed to work on average, but it doesn’t mean that gold and the S&P will move in the same direction on every single day. The metals didn’t react by soaring higher on Monday – they moved up rather insignificantly. Plus, miners were lower anyway.
The second thing is that Monday’s session was particularly volatile – something that investors were not prepared for emotionally. Some of them had probably bought gold and silver in hope of hedging themselves. After the session it turned out that it was not that helpful (the S&P was down 4%, while gold was almost flat, moving higher by less than 0.5%), so the following days of the general stock market’s decline may be characterized be much smaller willingness of the investors to purchase precious metals in hope of hedging their stock portfolios.
Yesterday’s session served as a confirmation of the “on average” type of link. On Monday stocks declined severely, while gold moved a bit higher. During yesterday’s session stocks moved a bit higher, but gold declined almost $20. On average, both assets declined. The link as well as the bearish implications remain intact.
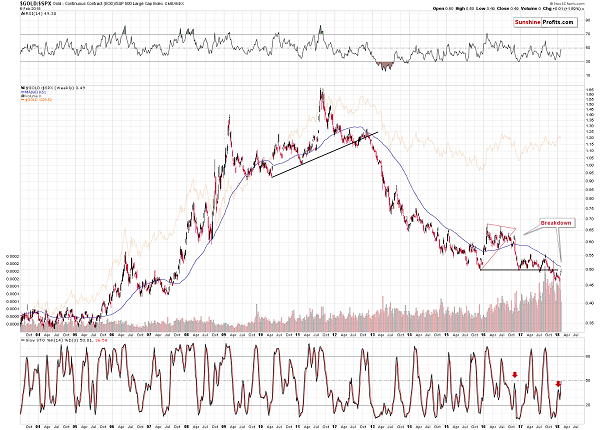
Moreover, even though the gold to S&P 500 ratio moved higher, there was no invalidation of the previous breakdown - only a move back to the previously broken support / resistance line. The 2016 and 2017 lows seem to provide strong resistance, just as they provided strong support in the previous years. The implications are bearish for the ratio and for the precious metals sector.
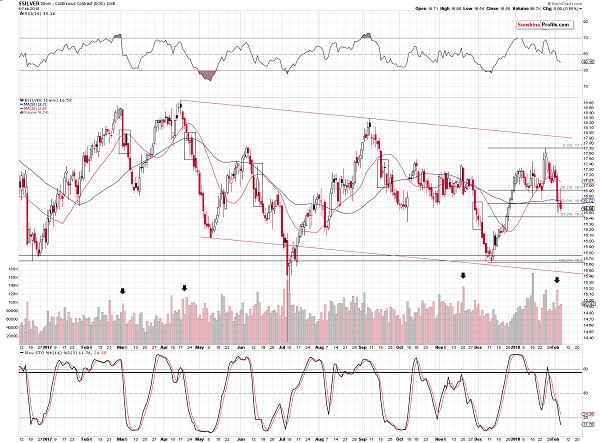
As far as silver is concerned, we see a corrective upswing that follows a sharp slide and a breakdown below the previous lows. A corrective upswing is something very natural at this stage of the decline and should not be viewed as a reversal.
We marked similar situations with black rectangles. Virtually all big declines had this kind of pause before the slide continued, so seeing one now is definitely nothing odd or bullish. Interestingly, in two cases (April 2017 and June 2017) silver corrected from below the 50-day moving average to slightly above it only to plunge in the following days. So far, the price action is similar.
Please note that the pauses didn’t take more than a couple of days, so it seems that this pause is over or about to be over.
Having said the above, let’s move to the questions that we raised in the opening paragraph of today’s analysis. We wrote that the situation is tense as there are good reasons for miners to reverse sooner rather than later and that there are reasons for the decline to continue. Let’s see them in detail.
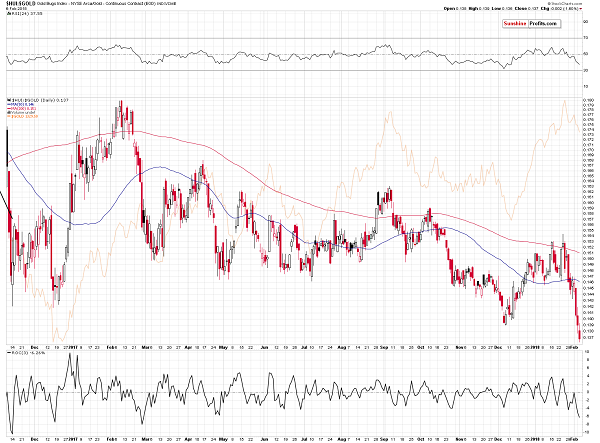
In the case of the gold stocks to gold ratio, we definitely have bearish implications. It was already after Monday’s closing price that we saw a small breakdown below the 2017 and 2016 lows, however, based on yesterday’s decline, the breakdowns are now clearly visible.
This opens the road to much lower valuations. Still, let’s not forget that verifications of breakdowns happen from time to time. For instance, in late October 2017, the ratio broke below the previous lows and consolidated before diving deeper. This corresponded to a relatively small – but still – corrective upswing in gold.
Then again, the above might have simply been a result of the cyclical turning point in gold (and in mining stocks). Consequently, it’s not clear if the preceding breakdown resulted in a verification, which in turn resulted in a small rally in gold. It seems more likely that it was the other way around. Gold and miners reversed their courses temporarily because of the turning point, but the corrective upswing was relatively small as – among other factors – the HUI to gold ratio was after a major breakdown and thus, there was a limit to how high the ratio and gold were eager to rally.
So, the question becomes, if we have a turning point nearby.
Not really, we already had one at the beginning of the month and it seems that the turnaround that preceded the turning point was the development that was likely to happen based on it.
Wait, there are turning points for mining stocks as well?
In short, yes, but it’s nothing entirely new - the turnings point for mining stocks are the turning points for gold, with additional sub-cycles in between.
We’ve been recently asked if it’s true that mining stocks have turning points between the 4th and the 10th day of the month. The reply is that this was the case in the previous year – but it’s moving toward the scenario in which the turning points are seen at or very close the end of the month. Consequently, the next turning point is not this week, but it’s already behind us - and the next one is at the end of February and the beginning of March.
In other words, there’s not much more to the 4th to 10th day of the month rule – it’s a cycle that will likely be continued, but the above rule will likely not. If you’ve been following our analyses for some time, you knew about this cycle all along (precisely, about every other cycle as that’s what appeared most useful for the gold market).
The additional thing that we can see on the above chart is that the volume that accompanied yesterday’s decline was quite sizable, so the bearish implications of the price-volume link remain in place.
So, based on the gold stocks to gold ratio and the turning points for mining stocks (GDX, HUI and XAU), it doesn’t seem that the turnaround has to be seen shortly or that it’s likely.
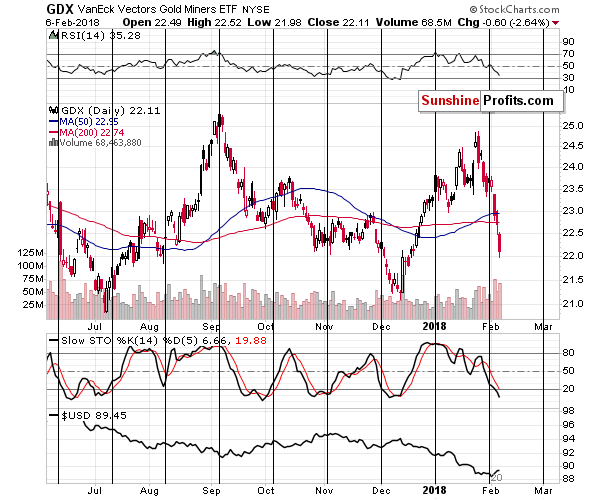
Still, let’s keep in mind that if the current bearish momentum persists, mining stocks will reach their 2017 lows very soon. The RSI indicator is already close to the 30 level and since reaching it is a classic buy signal for the short term, we may see at least a corrective upswing soon.
Overall, based on the previous two charts, it seems that we may indeed see a corrective upswing once miners move to (or very close to) their 2017 lows, but it’s not likely that the upcoming rally will be anything significant.
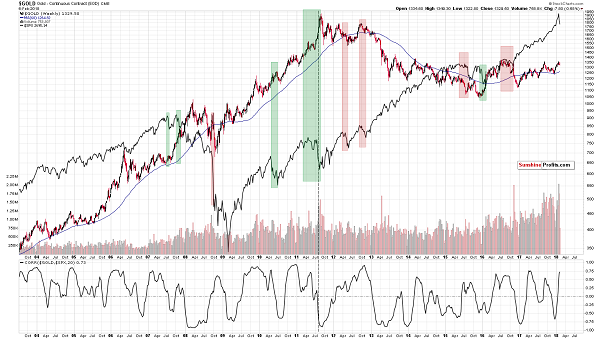
The long-term HUI Index chart shows that one should indeed think at least twice before trying to time the upcoming correction.
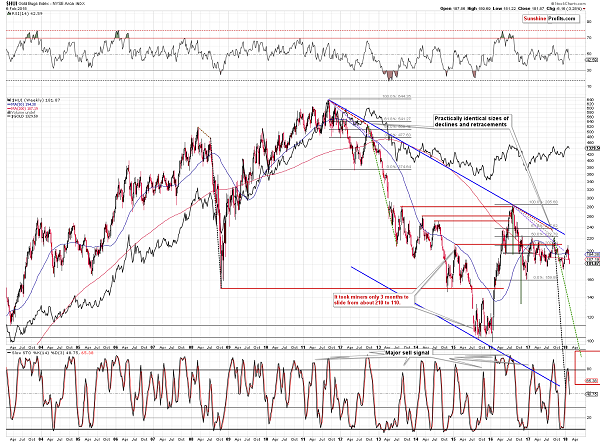
Let’s start with the thing that’s easiest to interpret. We just saw a long-term sell signal from the Stochastic indicator. Last year we saw it only twice and, in both cases, a big decline followed. This was the case also multiple times in the preceding years. Consequently, the implications here are bearish.
The thing that’s more complex, but also more rewarding from the analytical point of view, is the continuation of the analogy to the 2011 – 2013 period.
The 2011 and 2016 tops were preceded by substantial rallies, but they were shortly followed by big and sharp declines, and then by corrective upswings. This, by itself, is not enough to view these situations as similar, but the additional details are. These additional details are the sizes of the corrective upswings (about 50% in both cases as marked using Fibonacci retracements) and the – approximate – time that it took for the corrections to materialize. We marked the latter using red dashed lines. As you can see, the horizons are almost identical.
The declining purple, dashed line is a line connecting the top with the top of the first local move up during the decline. In this case, the price that was reached is correct only approximately and the time seems to be off for more than a month. The latter seems to be a violation of the analogy, but please keep in mind that the last couple of weeks were characterized by a sharp slide in the value of the USD Index that was only reflected in the PM prices to a small extent. In fact, in terms of the euro, gold topped very early in January, and taking this date into account would imply only a small deviation in the analogy present on the above chart. Overall, it seems that we can still view the analogy as present.
The interesting fact about the both initial local tops during the correction (the late-2012 one and the most recent 2018 one) is that they formed close to previous local tops.
What are the overall implications of the above? We should expect a big and volatile decline to follow. Last week’s performance and what we’re seeing this week seems to be just the very first sign of what’s to come. If the 2013 move is repeated, then we are likely to see the HUI Index well below the 100 level before the bottom is really in.
This may sound ridiculous, but the HUI at 200 sounded just as ridiculous when it was trading above 500 in late 2012. Yet, a year later, that’s exactly the value that we saw.
What does the above imply for the near term? Back in 2013, there was no visible corrective upswing until the HUI broke below the previous major low (the 2012 low). The analogous low is the late-2016 bottom, which is relatively far. So, if the analogy is to continue, then gold miners may move significantly lower without a bigger move higher.
Summing up, the outlook for the precious metals market is bearish for the following weeks - and it seems that even if we see a corrective upswing shortly, it will not be anything spectacular. At least not until gold stocks move to their 2017 lows.
On a side note, please note that our bearish comments on the precious metals sector doesn’t make us an enemy of gold and silver investors – it makes us a true (!) friend. If you ask your friends how you look before going to an important meeting, everyone will tell you that you look great regardless of the truth as they will prefer not to be the ones that ruin your mood by saying something unpleasant. But a true friend will tell you how things really are, so that you can fix something before your leave. This may be unpleasant, but ultimately, it’s the second approach that benefits you. Most gold promoters will want you to think that gold is going to go higher no matter what happens and all you should do is buy, buy, buy. And then buy some more. They don’t want to risk upsetting you. But not us. We’re that true friend that tells you what they think and why, regardless of the possibility of being unpleasant – so that you can benefit more. In this case, if we’re correct about the bearish outlook for the precious metals, it will be much more profitable to be buying at lower prices than at the current ones.
So, in our view, the outlook for the precious metals market is friendly bearish. The precious metals market is likely to move much higher in the coming years, but if we’re correct about the medium-term decline first, then the best buying opportunity is still ahead of us.
Przemyslaw Radomski, CFA
Founder, Editor-in-chief, Gold & Silver Fund Manager
Sunshine Profits - Free Gold Analysis
* * * * *
All essays, research and information found above represent analyses and opinions of Przemyslaw Radomski, CFA and Sunshine Profits' associates only. As such, it may prove wrong and be a subject to change without notice. Opinions and analyses were based on data available to authors of respective essays at the time of writing. Although the information provided above is based on careful research and sources that are believed to be accurate, Przemyslaw Radomski, CFA and his associates do not guarantee the accuracy or thoroughness of the data or information reported. The opinions published above are neither an offer nor a recommendation to purchase or sell any securities. Mr. Radomski is not a Registered Securities Advisor. By reading Przemyslaw Radomski's, CFA reports you fully agree that he will not be held responsible or liable for any decisions you make regarding any information provided in these reports. Investing, trading and speculation in any financial markets may involve high risk of loss. Przemyslaw Radomski, CFA, Sunshine Profits' employees and affiliates as well as members of their families may have a short or long position in any securities, including those mentioned in any of the reports or essays, and may make additional purchases and/or sales of those securities without notice.

Przemyslaw Radomski, CFA, is the founder, owner and the main editor of SunshineProfits.com. You can reach Przemyslaw at: http://www.sunshineprofits.com/help/contact-us/.
More from Gold-Eagle.com:


