Latest Gold Price Forecast & Predictions
Gold Price Now:
USD
$3,327.43
-16.52
-0.49%
Recent Changes
| Period | 2 Days | 3 Days | 1 Week | 2 Weeks | 1 Month |
|---|---|---|---|---|---|
| Change | +1.43% | +3.15% | +3.41% | +7.46% | +9.54% |
Gold Price Forecasts - Analyst Predictions
Gold-Eagle has been analyzing gold markets and publishing gold price forecasts for over 23 years. Our staff and contributing analysts include world reknowned precious metal experts and market analysts. The gold price forecast data below represents the average predictions of a diverse panel of expert gold market analysts. Their assessments of gold price trends are based on a variety of methods including: expert technical analysis, market fundamentals, current market sentiment, and an analysis of global economic and political events. Bookmark and/or link to this page to check back every week. Updated every Monday am.
Last Updated: February 07, 2025
Gold Forecast Short Term
Sideways
Price Drivers for next 6 weeks:
resistance at $3,000, markets & geopolitical uncertaintyGold Forecast 1 Year
Bullish: $3,550
Medium-term price drivers:
US dollar, bear market in stocks and recession, investor sentimentGold Forecast 3 Years
Bullish: $5,500
Long-term price drivers:
US dollar, trade wars, central bank monetary debasement, geopolitical uncertaintyFeatured Gold Price Forecasts
 Markets staged a dramatic short-covering rally on Wednesday after Trump announced a 90-day suspension of reciprocal tariffs. The S&P surged 9.5%, posting its third-largest gain since 1940.
At the same time, tensions flared as China struck back, raising tariffs on U.S. imports to 125%. A 10% baseline tariff now applies to all nations, while the 25% levies on steel, aluminum, and autos remain unchanged.
Gold, which had dipped below $3,000 following the tariff news, reversed sharply higher. Prices appear to be in a climatic blowoff phase, with a brief spike above $3,300 likely before a multi-month correction of 10% to 20%.
Gold miners also rallied to new highs after being tossed around in a volatile 15% swing last week. However, with gold nearing a significant top, the current breakout looks unsustainable. Buyers chasing the recent move may find themselves caught in a classic bull trap.
GOLD PEAKS AFTER STOCKS
At major market inflection points, equities typically peak first, with gold topping out a couple months later. Take the 2022 bear market, for instance: the S&P 500 hit its high in January, but gold continued climbing another 13% before topping out in March. This cycle appears to be following a similar pattern—stocks peaked in February 2025, and I believe gold is now in the final stages of its blowoff phase, with a top likely this month, potentially as soon as next week....
 With the action seen in recent weeks, the U.S. stock market is declining into an expected Spring cycle bottom, with Gold now joining in the decline. Each of these markets appear to have further to run before troughing, though we are into the window for a key bottom to form for U.S. stocks, which we will look at first.
U.S. Stock Market, Mid-Term
As mentioned back in January of this year, the mid-term cycles for the U.S. stock market were seen as pushing higher into the late-2024 to early-2025 region - before topping, and giving way to a sharp decline into this Spring.
The mid-term cycles for U.S. stocks are the 180 and 360-day waves, with the smaller 180-day cycle shown on the chart below, along with the S&P 500 index:
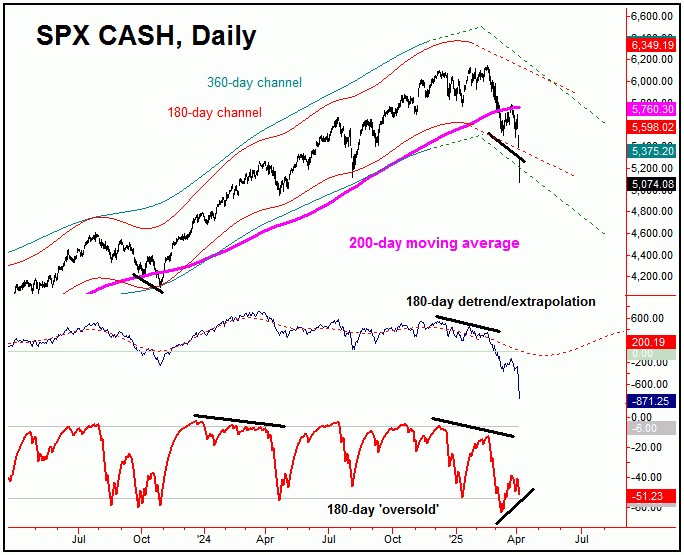
In terms of time, the next projected trough for our 180-day wave was due around mid- April of this year, but with a larger plus or minus variance in either direction - simply due to the size of the 180 and 360-day cycles.
In terms of technical action...
More Gold Price Forecasts

Gold hit our $3,150 price target in the first few days of April, and it seems the cycle has peaked. Silver dropped significantly after a slight new high, and recession fears could trigger a sharp decline.

Gold broke through $3,100 following a short consolidation, and we’re likely entering the final leg of the rally into an April peak. Silver futures closed above $35.00, and we’re at the critical point in the trend where prices could accelerate rapidly towards $40.00...

As mentioned in a prior article, the last correction of significance was due to play out with our 72-day time cycle, which ended up confirming a very early low - doing so with the late-February tag of 2844.10 (April, 2025 contract). With that, this wave is now seen...

In December, we advised readers that our cycle work expected an impending bottom followed by "a run towards $3,000+ by March or April."

With the action seen in recent weeks, Gold is in a confirmed downtrend with our 72-day cycle, a move which is anticipated to end up as countertrend - though it looks to have further to run. Stepping back, the bigger picture view for Gold is projected to remain...

The gold price hit a new record high this week, rising up to $2,942 in the spot market on February 10. Gold is now up 11% for the new year, after rising over 27% in 2024. After such a run, with gold just below the key $3,000 per ounce level, one might wonder if the...

As we move into the year 2025, I thought it would be a good idea to take a look at the configuration of the time cycles, for both the Gold market - as well as for U.S. stocks.

Gold skyrocketed to new all-time highs amid rising concerns over tariffs. Stockpiling in New York led to shortages in London ahead of Saturday's announcement. Since the November election, traders have moved (repatriated) nearly 400 metric tons into New York.

Gold is nearing its October high, and prices could move quickly towards $3,000. Silver is on the verge of a significant breakout, with the potential for a swift rally through $35.00. Gold miners have underperformed gold for years, but with prices still depressed, we...
Gold Price Forecast FAQ
How do you forecast the price of gold?
Predicting gold prices can be said to be both a science and an art. For example, analysis of gold supply and demand is scientific and completely objective whereas aspects of technical and sentiment analysis of the current gold market can be more of an art as it relies on the skills and perspective of the gold analyst.
Generally speaking, when the focus of the gold forecast is longer term then analysis of the fundamentals, ie scientific analysis, comes to the fore.
For shorter-term predictions of gold prices, the price of gold in the coming weeks and perhaps few months, technical analysis of past and current gold prices, market trends, as well as current market sentiment can be more actionable predictors. Here, the fundamentals can still play a role but generally serve more as background details.
What are the key factors for long term gold forecasts?
When forecasting what may happen to the price of gold longer term, there are many things to consider including economic trends, the impact of current and expected monetary policy, QE, debt monetization, and the aggregate impact on future currency valuation.
Does the price of gold go up when the stock market goes down?
The price of gold is often negatively correlated to the stock markets. When the markets go down, gold prices usually go up. However, this is not always true. Sometimes the price of gold and stocks both go up and down in unison. Fundamental factors play an important role and need to be carefully analyzed. Historically, however, the price of gold is not tied to the fluctuations of stock and bonds. This is one of the chief reasons when one should have gold in their portfolio – to protect the long-term value of your investments.
Does the value of the US dollar predict the price of gold?
As gold is traditionally quoted in US dollars, the price of gold is negatively correlated to the strength of the USD. The weaker the US dollar, the cheaper it is to purchase gold. Therefore, if economic factors predict a strengthening of the US dollar then this will tend to drop the price of gold, and vice-versa. According to the statistics (since 1973), the long-term correlation between the U.S. dollar index and the gold prices is -0.6 so this link is quite strong.
How do US interest rates impact future gold prices?
The level of US interest rates is an important driver of future gold prices. When investing in gold, the investor is faced with the opportunity cost of gold - a non-interest bearing asset. The higher the US interest rate for holding US dollars or investing in Treasuries, the higher the opportunity cost of holding gold. It is more likely, therefore, that a rally in the price of gold will be forecasted the lower the US benchmark interest rate.
Gold Forecast Analysts

Technical Analysis Expert & Editor @ GoldPredict.com
AG Thorson is a registered CMT through the MTA and an recognized expert in technical analysis of the precious metals markets. He is also the Editor of GoldPredict.com where members receive daily updates and regularly scheduled reports 3-days a w More...

Chief Analyst & Founder @ iGold Advisor
Christopher Aaron began his career as an intelligence analyst for the CIA and Department of Defense. He served two tours to Afghanistan and Iraq between 2006 - 2009, conducting pattern-of-life mapping for military leaders.Mapping shares similarities More...

CFA, Editor & Founder @ Sunshine Profits
Przemyslaw Radomski, CFA, is the founder, owner and the main editor of SunshineProfits.com. You can reach Przemyslaw at: http://www.sunshineprofits.com/help/contact-us/. More...
The world’s gold supply increases by 2,600 tons per year versus the U.S. steel production of 11,000 tons per hour.
Latest Gold Analysis

