Gold Forecast: Correction Followed By A Long-Term Buy

This report will cover our medium-term outlook for precious metals as well as gold’s longer-term forecast.
Our analysis suggests metals and miners probably topped last Friday. If correct, prices should drop for the remainder of April and into May. We will monitor the decline for momentum, and strength of trend. If prices move powerfully lower into May, we could see additional downside in June.
The dollar bottomed March 27th and prices may be on the verge of a breakout. Commodities, in general, should correct as the dollar rallies, probably to fresh highs.
Short-Term Analysis
US Dollar Chart
The dollar rallied Friday closing above the 101 level firmly. The next line of resistance is the downtrend line. Moving strongly through 101.50 will imply a breakout. Prices should rally into May or June as commodities correct.

Gold Price Chart
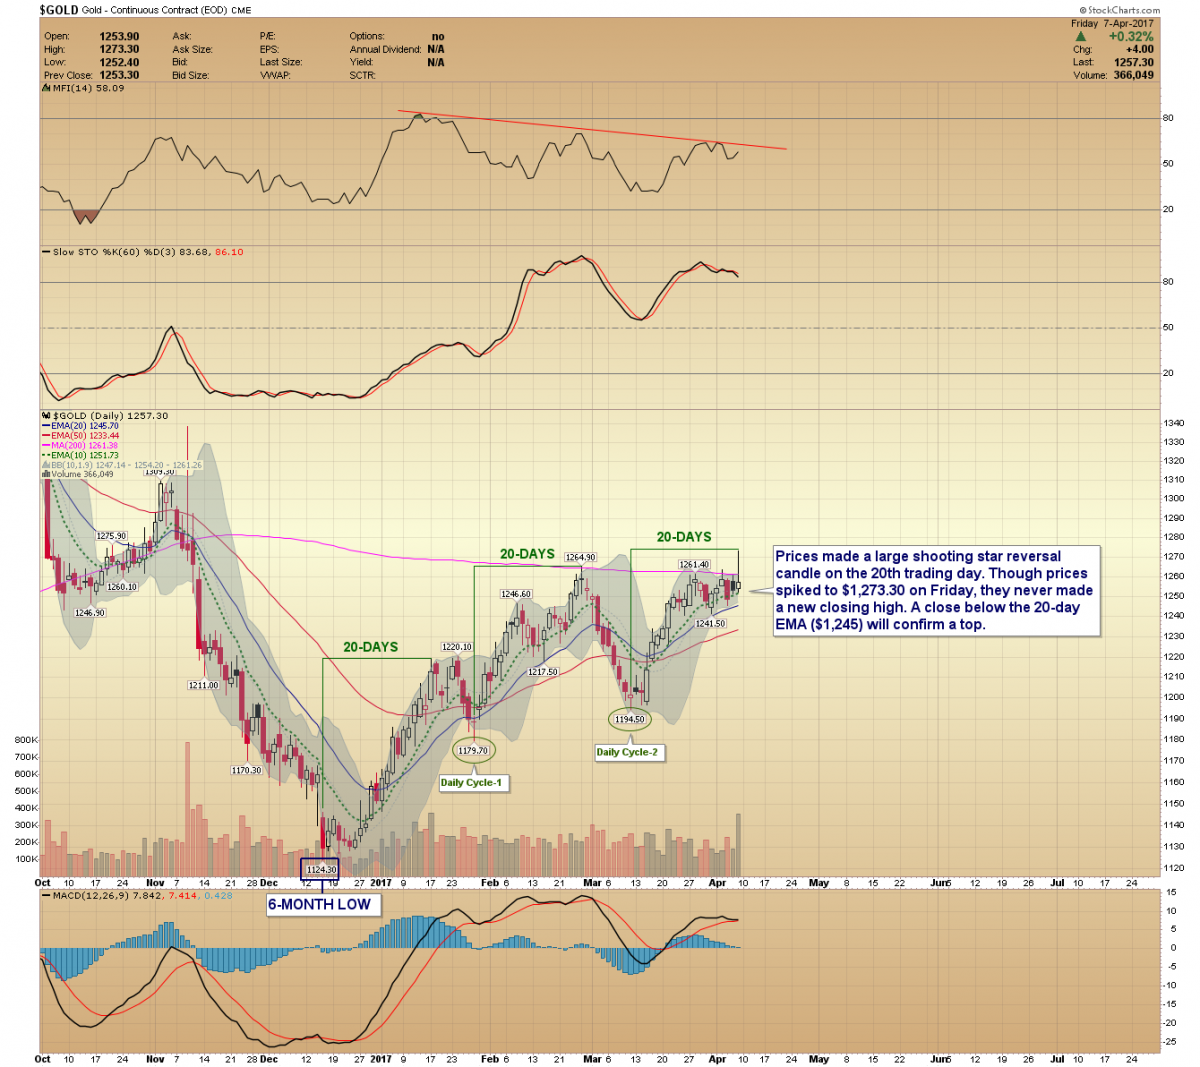
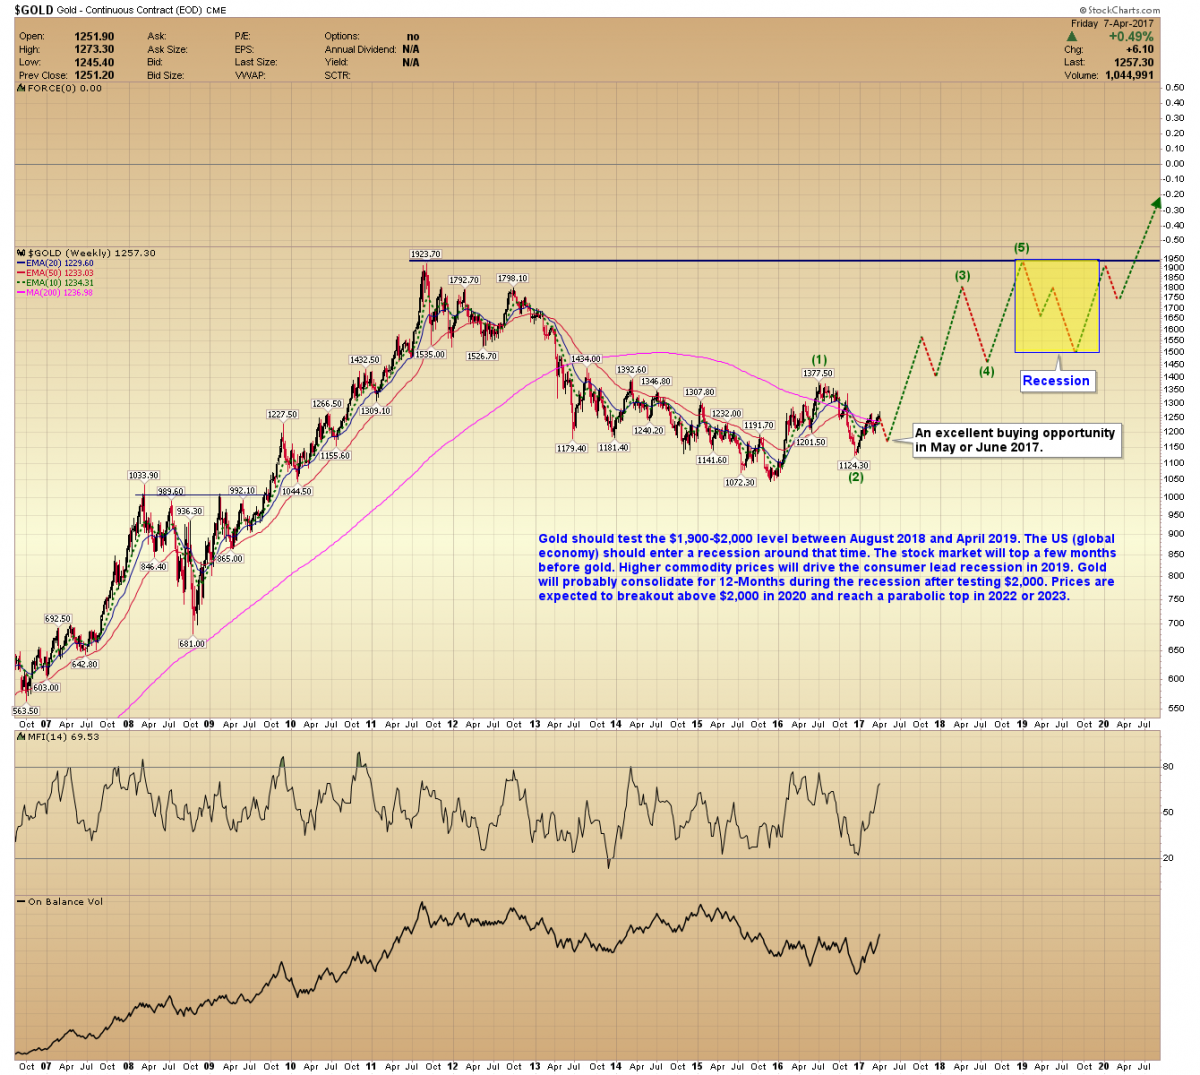
Gold prices made a large shooting star reversal candle on the 20th trading day. Though prices spiked to $1,273.30 on Friday, they never made a new closing high. A close below the 20-day EMA ($1,245) will confirm a top.
Silver Price Chart
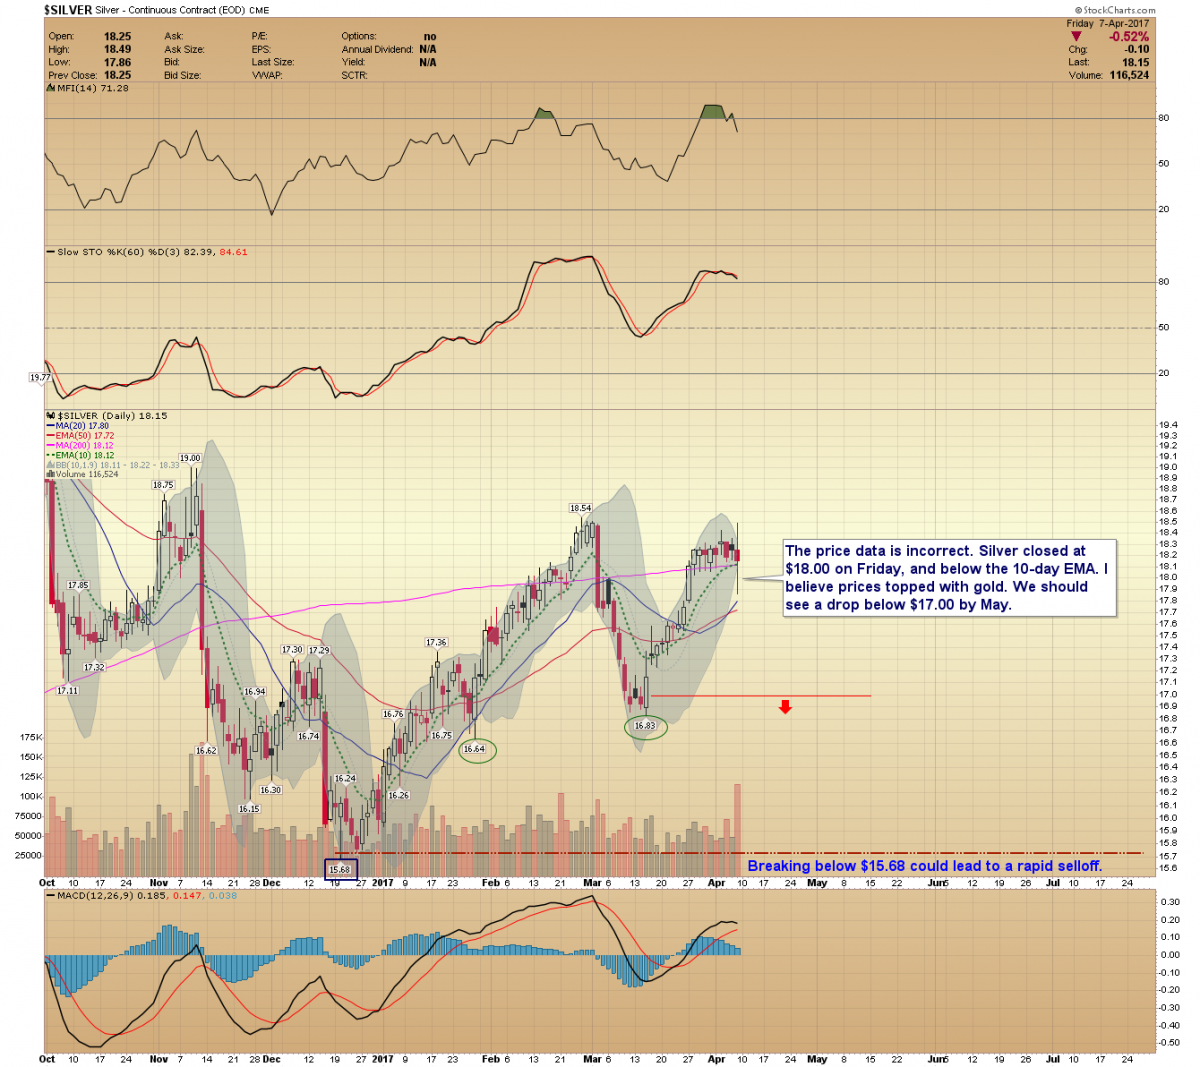
The silver price data is incorrect. Silver closed at $18.00 on Friday, and below the 10-day EMA. I believe prices topped with gold. We should see a drop below $17.00 by May. Breaking below $15.68 could lead to a rapid selloff.
GDX Chart
Prices likely topped Friday. To be certain, we need to see follow-through lower next week. Closing below the 10-day EMA ($23.22) and then below the trendline will confirm the next down leg. How sharply prices decline below the trendline will determine the May/June target. Prices should bottom around the May 5th employment report or by the June 14th FED meeting.

GDXJ Chart
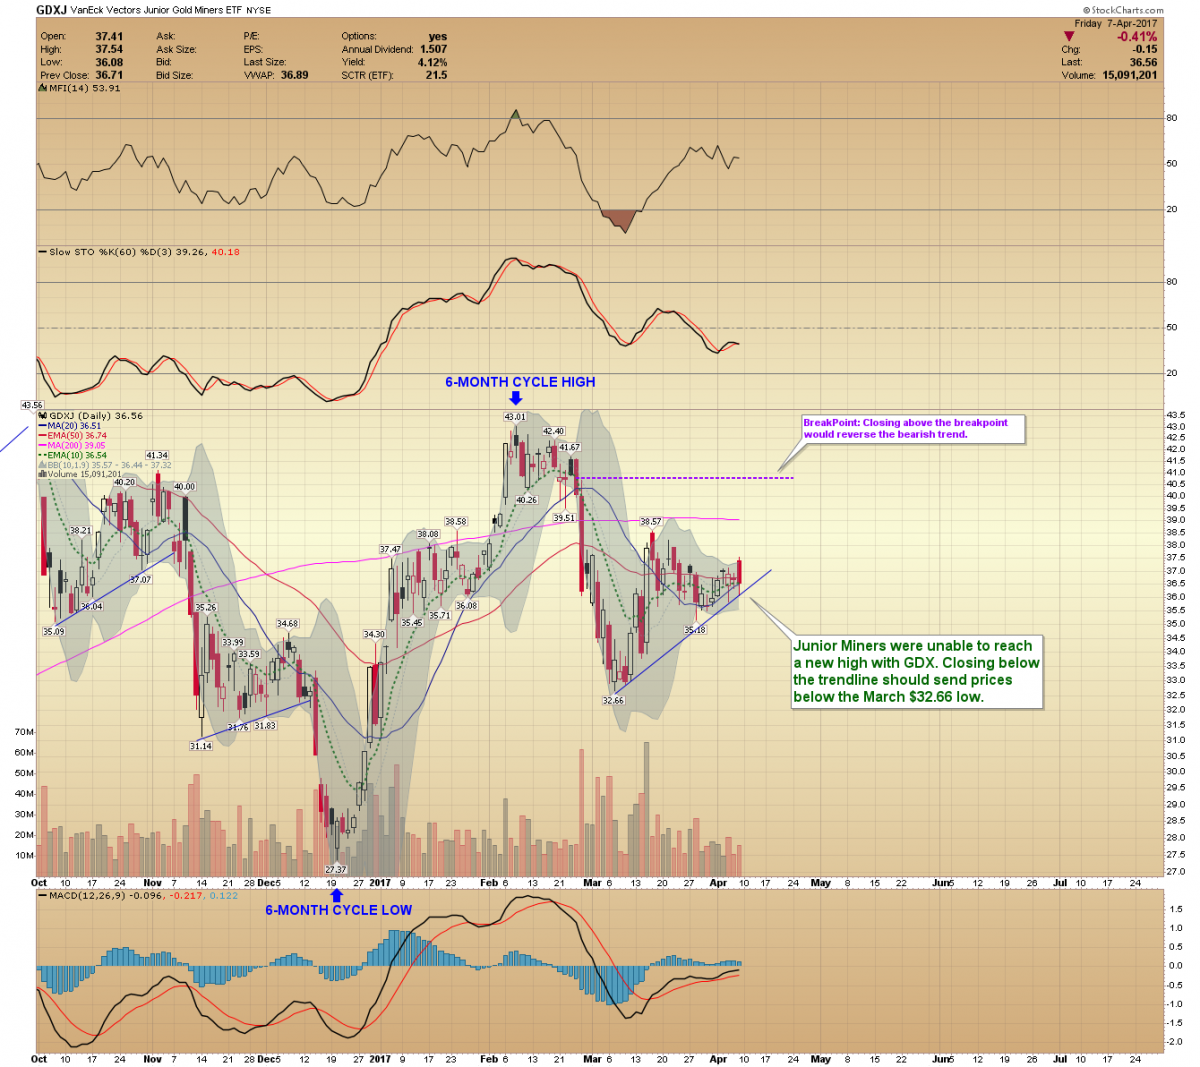
Junior Miners were unable to reach a new high with GDX. Closing below the trendline should send prices below the March $32.66 low.
Gold’s Big Picture
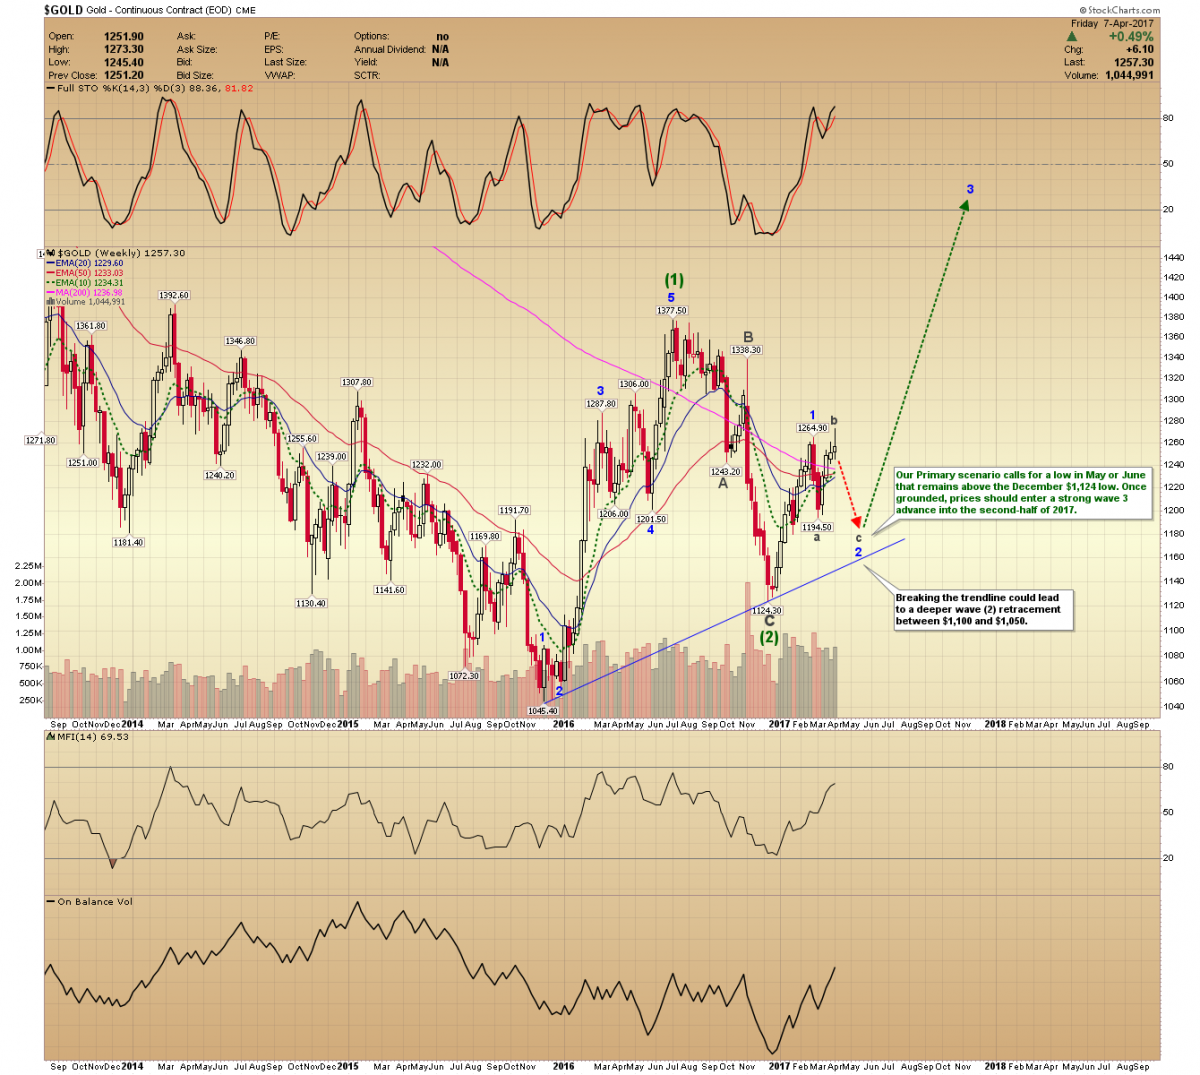
Our Primary scenario calls for a low in May or June that remains above the December $1,124 low. Once grounded, gold prices should enter a strong wave 3 advance during the second-half of 2017. However, breaking below the trendline could lead to a deeper wave (2) retracement between $1,100 and $1,050.
Gold Testing $2,000
Gold should test the $1,900-$2,000 level between August 2018 and April 2019. The US (global economy) should enter a recession around that time. The stock market will top a few months before gold. Higher commodity prices will drive the consumer lead recession in 2019. Gold will probably consolidate for 12-Months during the recession, and after testing $2,000. Prices are expected to breakout above $2,000 in 2020 and reach a parabolic top in 2022 or 2023.
Summary
Gold likely topped last Friday. Prices should reach an important low in May or June. The price action over the next few weeks will help us narrow down targets and timing. The May 5th unemployment report may clock the next low. However, prices could produce an additional down swing and bottom around the June 14th FED meeting. Once bottomed, prices should rally significantly during the second half of 2017.
********
Gold-Eagle provides regular commentary and analysis of gold, precious metals and the economy. Be the first to be informed by signing up for our free email newsletter.

AG is an accredited CMT through the MTA and the editor of GoldPredict.com. His members receive daily updates and regularly scheduled reports 3-days a week. He prides himself on making his analysis easy to understand through the use of adaptive and creative charting methods. You can reach AG at [email protected].
More from Gold-Eagle.com:


