Gold Forecast: Prices Set to Exceed 2016 Peak This Year

Having observed the strength of gold’s surge following the successful retest of its long-term 2011 – 2017 downtrend three weeks ago, the theme for gold now becomes one of working to overcome 2016 highs over the intermediate term. Our focus must therefore change from one of concern that the retest might fail, which implies a more conservative posture, to the health of the long-term basing pattern that is now rounding upward in terminal fashion. We believe new highs for the move that began in 2015 are in store for this year. Retracements will still occur and they will be scary at times, but in the establishment of a new rising trend we should look to be aggressive amidst dips and not fearful on corrections.
Gold Intermediate Outlook
Last week, gold prices finished higher by 1.0% or $13 to close at $1,322 as of the final trade on the New York COMEX futures exchange as of Friday afternoon.
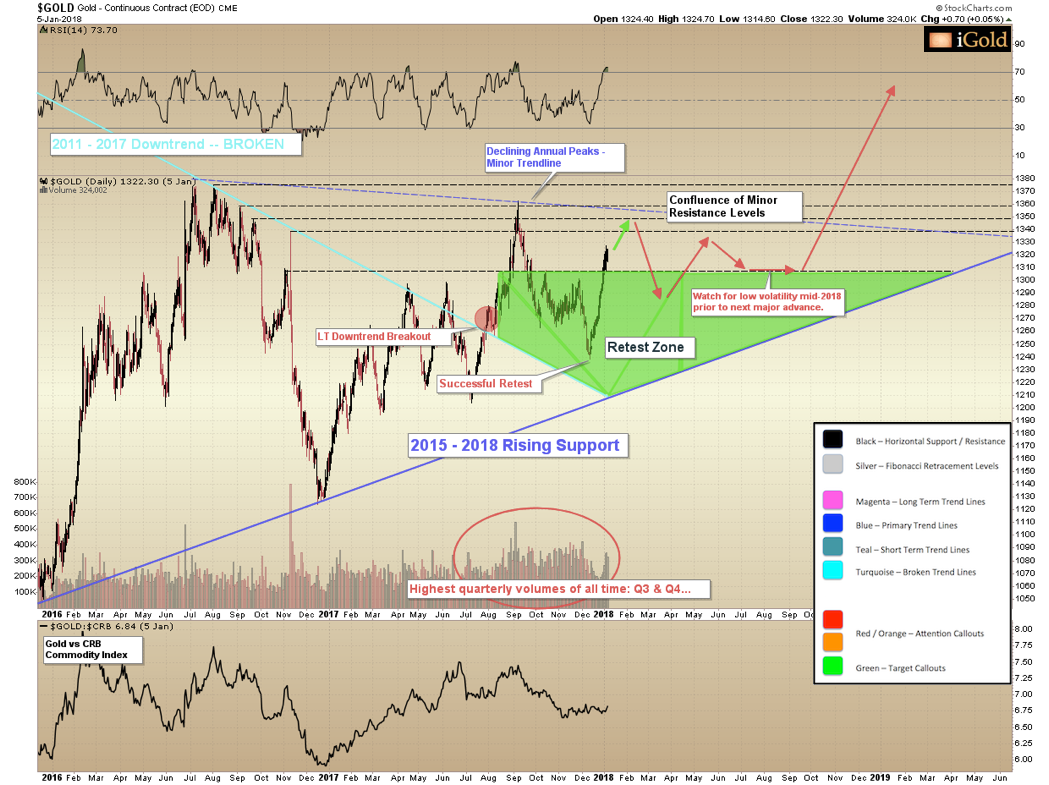
The primary gold chart has changed. Below is the updated version, with notes to follow:
-
We have extended the primary chart to include all of 2018 and into 2019. This remains the timeline for the next surge that we anticipate will develop.
-
The 2011 – 2017 downtrend, broken in August 2017 and successfully retested in December, has now been changed to the turquoise color on our primary charts. Under this technical system, each color has a meaning. We designate turquoise for broken trendlines, as we still want to remember a prior trend’s existence; however, we do not want to place primary attention there going forward. The color system will allow focus to be directed toward the most prescient areas within the chart foremost.
-
It is exceptionally bullish that over the past two weeks gold witnessed no resistance at the short-term October and November peaks of $1,308 and $1,301, respectively. Sellers were not present in this zone over the past two weeks, but they were indeed there last fall. In sum, the sellers appear to have been washed out of the market on the retest of Q4. This does not mean that gold will skyrocket, but it does show that resistance is light in the $1,300 region – a change from previous months.
-
We expect a short-term top to form for gold anywhere between Friday’s close ($1,322 in the futures market) and the area labeled Confluence of Minor Resistance Levels on the chart above ($1,338 - $1,378). This upper region is associated with each of the short-term peaks which were seen in 2016 (black dashed lines), and a minor declining trendline (dashed blue) which connects 2016 and 2017 highs.
-
The above-mentioned declining peaks trendline (dashed blue) is minor in relevance, and as it converges closely with the horizontal peaks (black), it is not expected to provide significant further resistance.
-
The retracement from the pending short-term top should bring prices back to within the green shaded zone. If the retracement were to occur from Friday’s peak, prices would target Fibonacci retracements of the December through January surge, which would be (not shown on chart):
-
38.2% Fibonacci retracement - $1,293
-
50% Fibonacci retracement - $1,282
-
61.8% Fibonacci retracement - $1,271
-
After a retracement, volatility should lessen as gold moves range-bound between the upper $1,200’s and mid $1,300’s into Q2 – Q3. We expect the gold market will get very quiet again for several months mid-year… just prior to 2016 highs being eclipsed in a strong advance.
-
We will begin to be able to plot a trend channel which will define gold’s advance into the $1,400’s as it develops. This will be useful for timing short-term entry and exit points through the remainder of 2018.
Gold Is Changing Stages
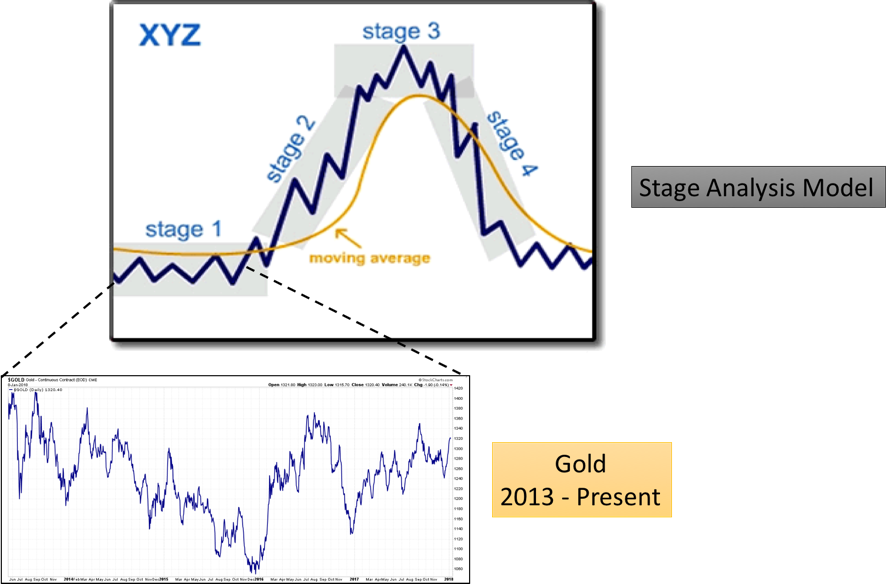
We encourage the finalizing of long-term positions on whichever retracement begins in gold over the next few weeks. Those who have bared the volatility of the past several years may have a difficult time imagining that a sustained rising trend could ever develop in the metals – but markets do change, and gold’s long-term pattern is on the verge of transitioning from a Stage 1 basing pattern to a Stage 2 advance. Illustrated below, a Stage 2 advance is the most powerful market to be involved in. We are not there yet, but after 5-years of prices moving sideways, we are indeed seeing hints that the terminal phases of the Stage 1 base are upon us:
Takeaway On Gold
Recent price action is encouraging for the advance we have been expecting for 2018 - 2019. Any retracement at this juncture should not break December’s low, and would provide a final buying opportunity in the $1,200’s before 2016 peaks are exceeded.
*********
Gold-Eagle provides regular commentary and analysis of gold, precious metals and the economy. Be the first to be informed by signing up for our free email newsletter.

Christopher Aaron began his career as an intelligence analyst for the CIA and Department of Defense. He served two tours to Afghanistan and Iraq between 2006 - 2009, conducting pattern-of-life mapping for military leaders.
Mapping shares similarities with technical analysis of the financial markets because both involve the interpretation of repeating patterns found in human nature. He is the founder of iGold Advisor, providing research on the precious metals, and iGlobal Analytics, featuring technical analysis of the global capital markets.
Christopher speaks regularly on the cyclical patterns found within the financial markets and on international policy. He has been featured in the New York Times and NPR news amongst other publications.
More from Gold-Eagle.com:


