Gold Price Cycles Playing Out As Expected, Tops Late-Dec
With the action seen last week, gold saw its low made in Monday's session, here doing so with the tag of the 1226.60 figure (February, 2019 contract). From there, strength was seen into late- week, with the metal pushing all the way up to a high of 1255.80 - an action that was forecast with the 34-day gold cycle channel.
Gold Cycles, Near-Term Picture
From last weekend: "any reversal back above the 1238.00 figure, if seen, would not only infer the 10-day wave to have troughed - but would also tend to favor the larger 34 and 72-day cycles to have also bottomed. If that were to end up as correct, then the probabilities would favor additional strength into the mid-to-late December timeframe or beyond."
Current analysis: As pointed out last weekend, any reversal back above the 1238.00 figure (February, 2019 contract) for gold would infer the combination of the 10, 34 and 72-day cycles to have troughed - an action which would favor additional strength into later this month, with a key turning point date coming up between mid-and-late December - where we would expect the next decent swing top to materialize.
Our 34-day cycle channel chart shows and updates the current action:
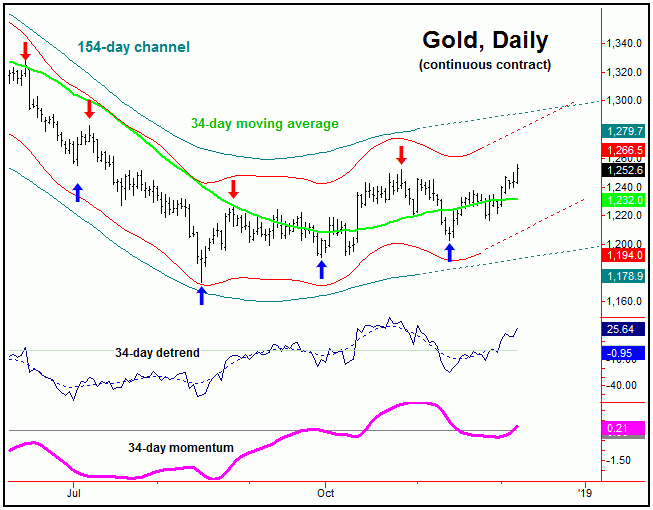
With the 34-day cycle having recently confirmed an upturn, our minimum upside target was to the 154-day moving average, which was easily met with action seen into late last week. In terms of time, both the 34 and 72-day cycles are seen as only 17 trading days along, and with that additional strength is favored into mid-to-late December, then to be on the lookout for indications of a peak - some of which we are now seeing.
Here is the chart that shows the larger 154-day cycle, which is expected to give us our next mid-term price peak:
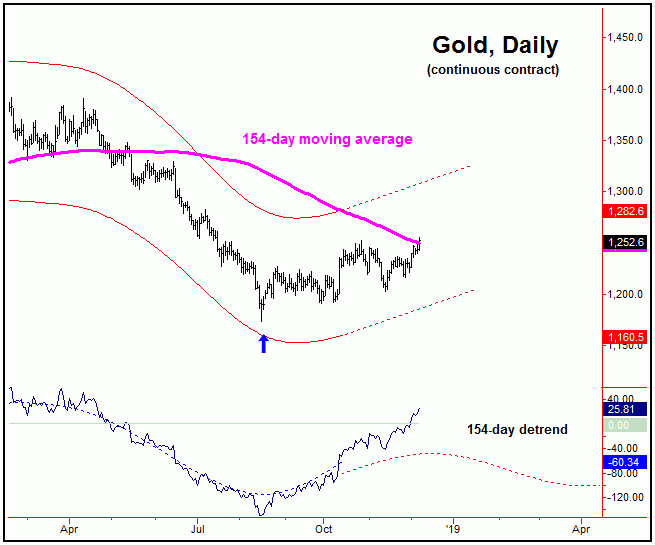
As noted above, the next mid-term peak is expected to come from the 154-day cycle, which is expected to top with the current upward phasing of the smaller 34 and 72-day cycles. Resistance to the current move - if tested - looks to be at or into the low-1300 area, and the entire move up is expected to end up as a countertrend affair, inside a larger bearish trend.
Gold, Longer-Term
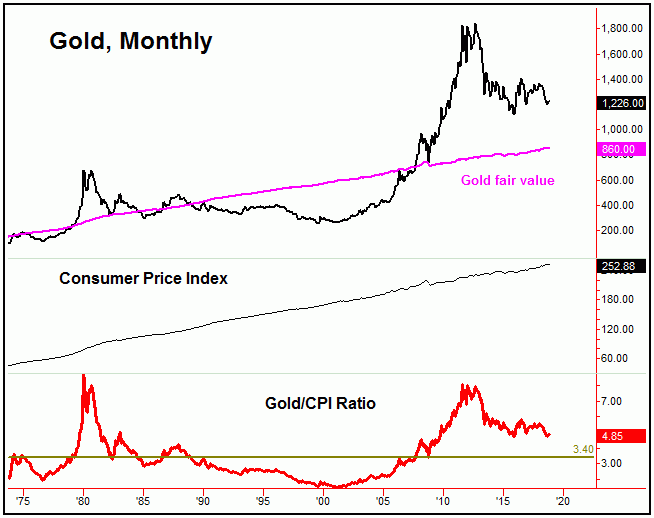
For the bigger picture, as noted many times in prior articles, the assumption is that Gold will see an eventual drop back to fair value, based upon the Gold/CPI ratio model. That is, in bear markets, the Gold/CPI ratio will nearly always return to its long-term average of 3.40, before the metal bottoms. Compare this assessment to the folks who are calling for gold to run to $2,000! Gold is currently at the same level as it was back in December, 2013 - when I began the Gold Wave Trader report (and we have beaten the metal handily since that time).
With the above said and noted, a drop back to fair-value for gold would mean a decline back to the 860 figure or lower, though, once again, I should add that this number is rising as each month progresses, and there is no timetable for this action to materialize:
Adding then to the notes above, the upward phase of the 154-day cycle is expected to end up as countertrend, and - if correct - should be followed by a push back below the August, 2018 bottom of 1173.60 on its next downward phase. In terms of time, that downward phase is currently projected to trough around late-Spring of 2019, but does have a large plus or minus variance in either direction.
Gold Timing Index
Where the Gold/CPI ration is our best longer-term indication for the gold market, our main indicator of mid-term direction is our (proprietary) Gold Timing Index - which is a combination momentum and sentiment indication for the metal, and is shown again on the chart below:
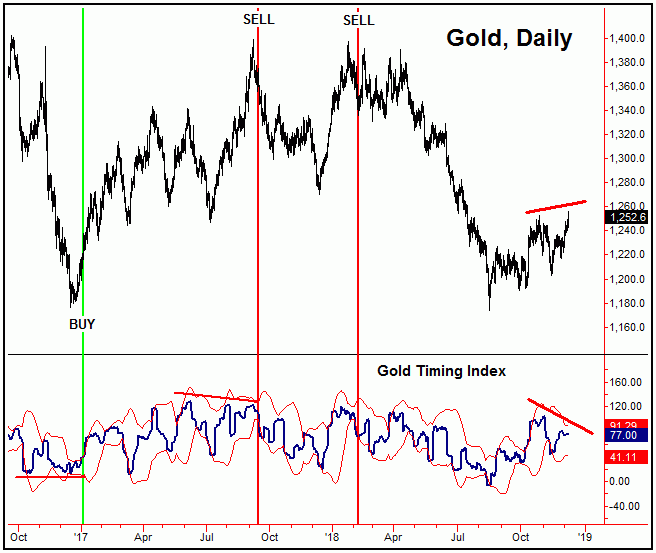
With the action seen last week, of note is that the higher price high is now accompanied by a divergence in our Gold Timing Index. This can be a negative going forward - though there is no guarantee this divergence will remain intact. Going further, the noted divergence is only the initial requirement for a mid-term sell signal, with the actual trigger being a close below the indicator's lower standard-deviation band - something which may or may not occur.
The Bottom Line
The overall bottom line with the above is that the upward phasing of the 34 and 72-day cycles is currently deemed to be in force, with the rally phase of these waves expected to set up the next peak for the larger 154-day component - ideally at some point later this month, with the next key reversal date noted in our Gold Wave Trader report. From this high, another mid-term decline phase is favored to play out into the Spring of 2019, with the potential for that decline to take out the August, 2018 low.
Jim Curry
The Gold Wave Trader
http://goldwavetrader.com/
http://cyclewave.homestead.com/
********
Gold-Eagle provides regular commentary and analysis of gold, precious metals and the economy. Be the first to be informed by signing up for our free email newsletter.
More from Gold-Eagle.com: