Gold Prices: Glorious Bull Or Dead Cat Bounce??
One often cannot disassociate one's personal views from his objective analysis. I can look at the charts and see both a continuation of a great bull market in gold or a dead cat bounce going nowhere. However, just applying the simple analysis solves that dilemma, rightly or wrongly.
Friday’s trading in gold futures was pretty hectic. Inter-day gold advanced just a hair short of $100, but closed the day up $59.30. It moved well into new recovery highs...breaking above trend lines and point and figure chart resistance levels. All this bodes well for the thought that gold is continuing its great bull move which started in December of 2015.
What about that dead cat bounce idea? Well, gold hit a high of $1362.60, but ended the day at $1322.4 (this is the data from eFutures.com for the Aug ’16 contract which had over 500,000 contracts on the day, very heavy). That’s a decline of $40.20. There are very few days over the past several months that we have had such a big decline during the same day. I don’t have the information, but would be very curious as to when the heaviest volume of trading occurred - during the rise to the top, or the decline to the close. In any case, I could, with the right perspective, see this as a dead cat bounce.
Now for the simple analysis.
Long-Term
Since the start of the intermediate-term bull in mid-January, and the long-term a few weeks later, the long-term bull has not wavered. It has remained bullish with a few cautions along the way. No need to go into details at this time as nothing much has changed for many weeks, or months.
As for the long-term stock performance of the Merv’s 100 stocks, they declined a little on the week despite the Friday surge. The long term BULL/BEAR rating now stands at 92% positive and 4% negative.
Intermediate-Term
Gold had been toying with the intermediate-term moving average line until that surge on Friday. It is now well above its moving average line, and the line slope is upwards. As for the strength of the recent move, that has also perked up. The momentum remains in its positive zone and, although it was below its trigger line for a couple of days, it is once more above its trigger line sloping upwards. All is in sync on the simple intermediate-term indicators and, therefore, the rating remains bullish.
As for the BULL/BEAR performance of the Merv’s 100 stocks, that is little changed at 65% positive and 15% negative.
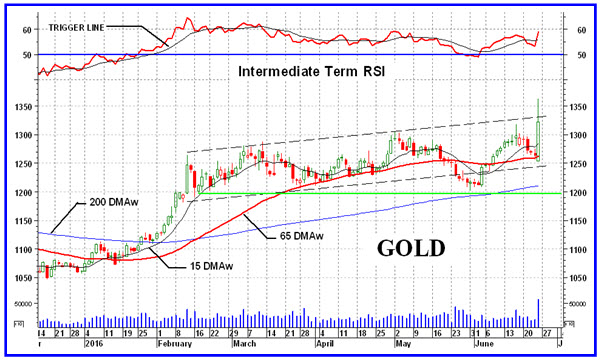
There are two features on the technical charts that I should mention.
First, there is the bar chart shown today. I have traced the previous slight upward trending channel on the chart (dash lines). This shows a short downside break a few weeks back, and now an upside break on Friday. That upside break, however, did not last and the price closed inside the channel. This would suggest a lateral to a downside move ahead, back towards that lower support line, confirming a dead cat bounce move on Friday. The next few days might just settle this point.
The second feature is my intermediate-term point and figure chart. It initially gave an upside break at the $1200 level with a projection to the $1350 level. That projection was reached on Friday. In the process, it had made a new break going through the $1325 level with a new projection between $2150 and $2250, depending on how you count the pattern. Because of the way "point and figure" charts are plotted, they have no knowledge of bar chart features, such as a dead cat bounce. Therefore, do not take it into account. There is nothing magic about P&F charts or their message. Using them for many, many years my view is that one should not ignore P&F break-outs or their projections. I have found that at the initial break the projection is about 80-90% accurate with the accuracy of subsequent projections slowly declining as the move progresses.
Short-Term
With Friday's surge, the short-term indicators follow. I am not comfortable with the short-term indicators after such a one-day surge, but would like to see a few days after the surge to see how things develop. It just suffices to say that everything is positive after Friday and the short-term rating is bullish.
As you can imagine, after the Friday close the BULL/BEAR ratings of Merv's 100 stocks moved more positive. They now stand at 71% positive and 16% negative.
Gold Stocks
So, after a day like Friday how did the gold and silver stocks do?
On the week my Merv’s Gold and Silver 100 Index closed up 3.42%, while my Merv’s Penny Arcade 50 Index closed up only 1.32%. This suggests a 100 Index ratio 2.6 times the Penny Arcade Index. From this one week one might view this as speculators moving to the higher quality stocks from the more speculative variety. This would not be a good sign for a bull market. It could, however, suggest that after a spectacular upside move by the Penny Arcade a rest period was in order and natural with more advance to come after the breather. For now, I’ll go with this explanation.
A few days ago, I posted my Merv’s Penny Arcade 50 Index Table on my Facebook page. This shows the 50 component stocks and their latest technical position (at last week’s close). I will post this table periodically and will also post my Merv’s Gold & Silver 100 Index when it is ready.
Readers are invited to view my Facebook page at https://facebook.com/merv.burak where I will be slowly posting commentaries explaining in more detail my various indicators and techniques.I also present, from time to time, some individual stocks that look as if they may be good speculations. However, nothing I post is meant to be a recommendation to buy or sell. One should check with their broker or investment advisor before acting.

Merv is a retired Aerospace Engineering consultant. He is also a retired market technician with over 40 years of market experience and research. Merv received his certification as a Chartered Market Technician (CMT) in 1992. Developer of many technical techniques and programs which he has been using in his previous Technically Speaking with Wil-Arm and Technically Precious with Merv commentaries posted throughout the globe. Developer of several gold and silver Indices, Merv continues to update his Merv’s Gold & Silver 100 Index and Merv’s Penny Arcade 50 Index and reviews them during his periodic on-going Technically Precious commentaries.
More from Gold-Eagle.com:


