Gold's Monthly Reversal Level Revisited

Last week's action saw gold forming its high in Tuesday's session, here spiking all the way up to a peak of 1442.90. From there, however, a consolidation to the downside was seen into later in the week, with the metal dropping down to a low of 1401.40 - before bouncing off the same into the weekly close.
Due to time constraints this weekend, my article has to be abbreviated, though I did want to post an update to an article I posted over a month back.
Gold's Key Monthly Reversal Level
From my 5/26/19 article: "there is a key ‘reversal point’ on the monthly chart for the metal, which - if taken out on a monthly closing basis - would flip the bigger trend back to UP. That key price is the 1360.00 figure for the June, 2019 contract, a number which is expected to drop slightly as time progresses. Adding to that, any monthly close back above the 1360.00 figure (June, 2019 contract) for gold - if seen at any point going forward - would be our best indication that a larger rally is in play, one which could see additional strength up to the 1500 level in the months to follow."
Current analysis: As pointed out in late-May, a key monthly level was the 1360 figure for gold - which we have easily closed above here in the month of June. This is the first close above a monthly ‘reversal point’ in over three years - with the last of these occurring back in early-2016. Monthly reversals normally set the trend for many months into the future, and with that we have to assume that the primary trend for the gold market has switched back to UP.
With the above said and noted, the overall assumption going forward is that additional strength will be seen in the coming months, though with the normal up-and-down gyrations in-between. In terms of price, in taking out a monthly reversal level we can often get an initial estimate of how much higher the market will go by taking the prior bottom (i.e., 1274) - and subtracting that from the June close (1413) - a difference of 139 points. Adding that to the June closing price of 1413 and there is the potential for a push up to the 1552 figure in the coming months, though it could take some time for this to play out.
Short-Term Outlook for Gold
As pointed out last weekend, a short-term correction was coming due - and was expected to materialize with the smallest cycle that we track, the 10-day wave. That correction phase is now seen as in force, and with that we could continue to hold in more of a sideways-to-down consolidation in the coming days, with the next 10-day trough due again at anytime. In terms of patterns, the downward phase of this 10-day wave is expected to end up as countertrend, to be followed by higher highs on the next swing up - then to peak the larger 34-day wave, which is shown on the chart below:
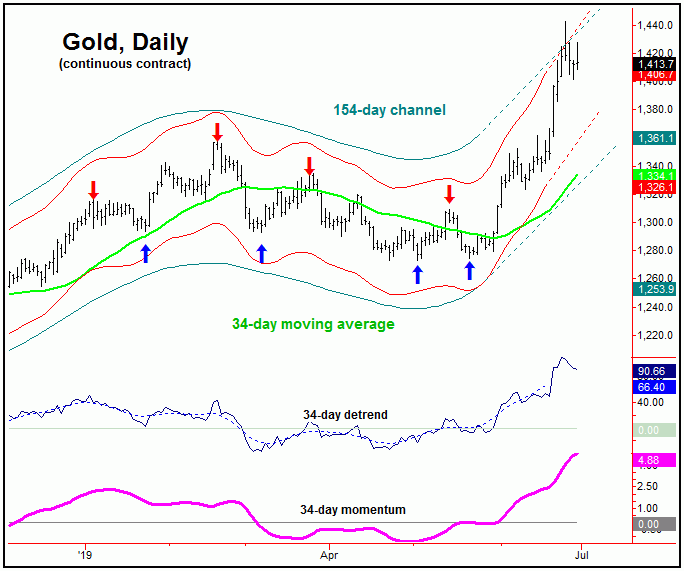
Stepping back, the next peak for the 34-day wave should also give way to a correction, a move which is anticipated to end up as another countertrend affair - to be followed by higher highs again into later this Summer. From there, a more important peak should try and materialize, coming from a larger 72-day cycle that we track, which is next projected to bottom around the month of September, but with a good plus or minus variance in either direction.
Commercial Hedgers
As noted in prior articles and reports, the most negative technical indication for gold comes from the position of the commercial hedgers, which is shown again on the chart below:
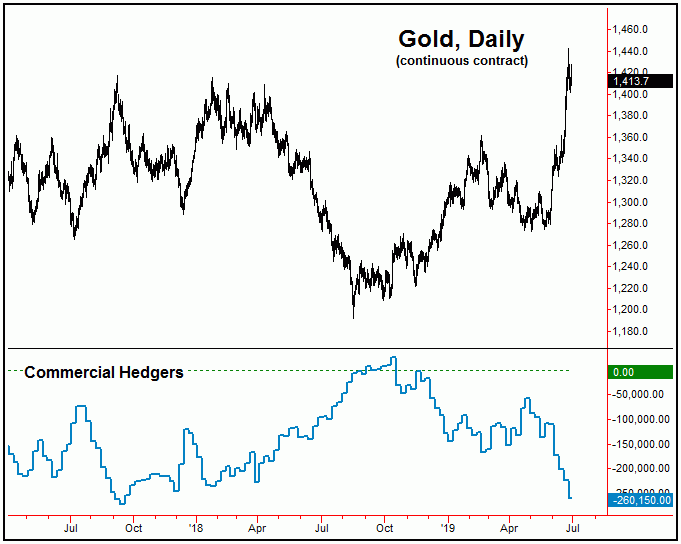
With the action seen last week, the hedgers have added another 40,000 shorts (approximately), which puts their current net bearish total up to 260,150 contracts - with the data current to the 6/25/19 close. This is now their largest bearish position seen since forming the September, 2017 price peak - where they were net short some 272,000 contracts. It is hard to see this as anything other than a negative for gold, though, as noted in recent weeks, the hedgers are scale traders, and can continue to add shorts on further price strength.
Regardless of the above, the commercial hedgers certainly appear to be positioning for a decline, which we think will come, but from higher highs than already seen.
U.S. Stock Market
The U.S. stock market is following our forecast path very well. That is, the cycles were looking for a decline into the mid-May timeframe, plus or minus, with that move having been expected to end up as countertrend - against the 2722.27 swing low from March. From there, the odds were in the range of 90%-or-better that a push back to new all-time highs (above 2954.13 SPX CASH) would be seen on the current upward phase, which has easily been met. Having said that, we are looking for continued strength in stocks in the coming months, with the low-end 3000's looking to be an ideal magnet - before the next peak of significance attempts to form.
Jim Curry
The Gold Wave Trader
http://goldwavetrader.com/
http://cyclewave.homestead.com/
*********
Gold-Eagle provides regular commentary and analysis of gold, precious metals and the economy. Be the first to be informed by signing up for our free email newsletter.
More from Gold-Eagle.com:


