Preparing For THE Bottom: Part 4 – Gold Stocks And Bonds
In the first part of the Preparing for THE Bottom series, we emphasized the need to be sure to stay alert and focused in the precious metals market, even though it may not appear all that interesting. We argued that preparing for the big moves in gold that are likely to be seen later this year should prove extremely worth one’s while. In the second part of the series, we discussed when, approximately, one can expect the key bottom in gold to form (reminder: this winter appears a likely target) and in the third part of the series, we discussed one of the confirmations that could indicate that the final bottom is in or at hand – the gold to silver ratio. The latter is not the only important ratio that one needs to keep in mind and in today’s article, we’re going to discuss two additional ones: the one based on gold and bond market and a second one, which includes gold stocks and gold. Both ratios add to the clarity regarding the upcoming bottom and they could be used as confirmations that the bottom is indeed in or at hand.
Let’s start with the gold stocks to gold ratio (charts courtesy of http://stockcharts.com).
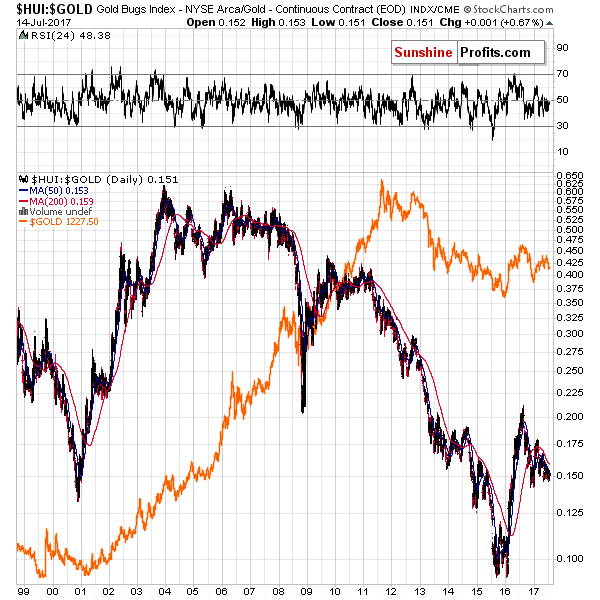
There are exceptions to this rule, but in general, the big upswings in the ratio are seen along with big rallies in the prices of gold. In other words, during and, at times, before big moves, gold stocks tend to lead the way up. The opposite can be seen in the case of the big downswings.
Before moving further, please note that from the very long-term point of view, both the gold/gold stocks link and the price of gold itself are not very closely connected and gold stocks appear to have lost a part of their gleam. This is true to a large extent and two important reasons behind this are the increase in costs (please note that gold stocks were doing particularly well until crude oil broke decisively above $35 in 2004) and the increase in popularity of investment / trading vehicles that combine the ease of investment with leverage (leveraged ETFs), which vehicles make the unclear leverage that gold stocks provide less appealing.
Still, please note that significant bottoms like the 2008 and 2015 one were followed by sharp comebacks in the ratio, which means moving part of one’s precious metals capital into the mining stocks sector can make a lot of sense from the diversification and profitability point of view.
Moving back to the predictive power of the ratio, the important thing is that the medium-term trends tend to be aligned and the same goes for the major tops and bottoms. The exception is the 2011 top, but this top was truly exceptional (the final gold-euphoria-driven top), so it doesn’t seem to invalidate the above general rule.
The shape of the relationship is not crystal clear, though. Not all bottoms and tops in the ratio imply important bottoms and tops in gold. On the other hand, almost all important bottoms and tops in gold were seen along with an important top in the ratio. What does it mean? That one shouldn’t use the ratio alone as a way to determine whether a major bottom or top is in, but it is very useful as a confirmation for gold’s extremes. In other words, if the ratio is likely forming a top or bottom and there are other reversal signs from the other markets, then the performance of the gold stocks to gold ratio further increases the reliability of these signs, but if there are no other reversal signs, then the gold stocks to gold ratio itself doesn’t indicate a reversal in a reliable way.
So, where can we expect the above ratio to bottom? For details let’s examine the inverse version of the ratio (gold to gold stocks) as it’s easier to discuss targets that are above 1 than fractional ones).
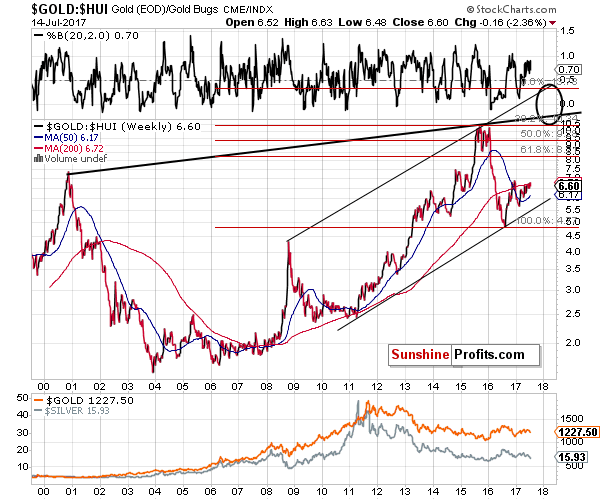
The target area is between 10.5 and 14, which (with gold below $1,000) could correspond to the HUI Index between 80 and 60. The target area is based on the 2015 top, the rising long-term resistance line (based on the 2000 and 2015 tops) and the second rising resistance line (based on the 2008 and 2015 tops).
The additional technique that we used are the Fibonacci extensions. They work similarly to the Fibonacci Retracements – they differ, because the latter provide targets between the levels that were already reached, while the former are usually used to provide targets outside of the previous trading range. In this case, we get a confirmation of the target based on the more short-term resistance line around the 14 level.
The remaining two techniques point to 10.5 – 11 as the next resistance. Which of these levels will stop the rally in the gold to gold stocks ratio? At this time it’s unclear, however, it doesn’t really matter that much as – as we explained earlier – the ratio is not to be used as a buy or sell signal on a stand-alone basis, but rather as a confirmation of other signals (thus we will look at other factors first and then check if the ratio confirms them, not vice-versa). So, if, for instance, we see the ratio at 10.7, but no meaningful signals from other long-term indicators, it’s not likely that the top is in yet.
Conversely, if there were meaningful long-term buy signals and they were seen when the ratio was at 13.6, we would view them as confirmed and even more meaningful, even though the ratio was only close to its target and not yet right at it.
Having said that, let’s move to the gold to bonds ratio.
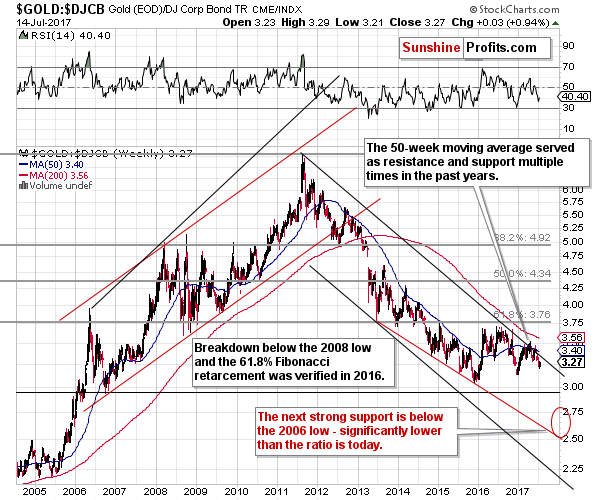
The gold to bonds ratio is in a rather clear downtrend. In 2014 it moved below its 61.8% Fibonacci retracement and the 2008 lows and this breakdown was verified in early 2015 and several times in 2016. It seems that the ratio can now resume its downtrend.
The 2015 level could theoretically stop the decline (in general, previous bottoms create support levels), however, this would be the first time that something like that has happen since the 2011 top. In other words, in the case of this ratio, this technique doesn’t seem to work and it thus appears likely that something else will need to provide the final support.
In the case of the 2011 top and the thing that preceded it, it was the less steep of the rising resistance lines, so – in analogy – perhaps it will be the less steep of the declining support lines that will stop the decline this time.
In both cases, we considered the long-term trend channels and the lines based on the previous extremes. In case of the 2011 top, the less steep line was approximately the upper border of the trend channel and in this case it seems that the line is based on the previous bottoms (note that it’s based on 5 bottoms, so it had already worked 3 times). Back in 2011, the ratio topped a bit below the line, so it wouldn’t be surprising to see the ratio bottom a bit above the support line, and that’s exactly what the target area represents – the price-time combinations above the support line.
The additional price target is provided by the 2006 bottom, however, please note that the previous bottoms were not particularly useful as precise (!) support levels either – none of the bottoms that ended the sharp 2013 slide formed at the 2008 bottom despite its proximity.
Consequently, we continue to view the declining support line and the red target area as more reliable. What are the implications? Exactly as the implications of the targets being reached in the case of the gold to gold stocks ratio and in case of the gold to silver ratio. Namely, when the ratio approaches its target area, all other signals will become more important. In other words, the mentioned ratios serve as tools in the investors’ arsenal that can help to determine whether or not the final bottom is in or at hand. None of them is a crystal ball, but they are all things that one needs to keep in mind when investing capital in this promising sector. We’ll discuss other important issues regarding the final bottom in the precious metals market in the following parts of the Preparing for THE Bottom series.
Summing up, the gold to gold stocks ratio and the gold to bonds ratio will provide us with additional important confirmations that the final bottom in the precious metals is indeed in. And while it seems that the bottom is still ahead of us, it doesn’t mean that it’s a good idea to delay preparing yourself to take advantage of this epic buying opportunity (after all, in our view, the biggest gains in the following years are likely to be made in the case of the long-term investment capital).
********
If you haven’t already signed up to our free gold newsletter, it may be a good idea to do so now – you’ll stay updated on our free articles (including the follow-ups to the above article) and you’ll also get 7 days of free access to our premium daily Gold Alerts as a starting bonus.
Przemyslaw Radomski, CFA
Founder, Editor-in-chief, Gold & Silver Fund Manager
Sunshine Profits - Tools for Effective Gold & Silver Investments
* * * * *
All essays, research and information found above represent analyses and opinions of Przemyslaw Radomski, CFA and Sunshine Profits' associates only. As such, it may prove wrong and be a subject to change without notice. Opinions and analyses were based on data available to authors of respective essays at the time of writing. Although the information provided above is based on careful research and sources that are believed to be accurate, Przemyslaw Radomski, CFA and his associates do not guarantee the accuracy or thoroughness of the data or information reported. The opinions published above are neither an offer nor a recommendation to purchase or sell any securities. Mr. Radomski is not a Registered Securities Advisor. By reading Przemyslaw Radomski's, CFA reports you fully agree that he will not be held responsible or liable for any decisions you make regarding any information provided in these reports. Investing, trading and speculation in any financial markets may involve high risk of loss. Przemyslaw Radomski, CFA, Sunshine Profits' employees and affiliates as well as members of their families may have a short or long position in any securities, including those mentioned in any of the reports or essays, and may make additional purchases and/or sales of those securities without notice.

Przemyslaw Radomski, CFA, is the founder, owner and the main editor of SunshineProfits.com. You can reach Przemyslaw at: http://www.sunshineprofits.com/help/contact-us/.
More from Gold-Eagle.com:


