Silver Does it Again! Severe Consequences – And Possible Major Top In Gold Price!
In the free analysis that we posted last Monday, we warned that Friday’s session was likely to be volatile and tricky. This seems to have indeed been the case for silver. The white metal declined early in the day only to rally almost 40 cents from the initial low. In our previous alert, we discussed the possibility of silver topping at about $16.65 and this level was reached. Is silver about to take a dive just like it did in late November 2017?
In short, yes. That seems very likely, especially in light of the multiple long-term and short-term factors and we have received a strong bearish confirmation earlier this week. However, we need to supplement the above with a caveat – the decline may not start immediately, but in a few days. Why? Because of the proximity to the triangle apex reversal along with the lack of a visible rally on Friday suggest that we may still be a day or two away from the top.
The key word from the above paragraph is may. The mentioned combination of bearish signs could be immediately followed by a big slide. That’s how silver performs quite often right after a session during which it outperformed.
Silver Repeats Itself for Those Who Were Not Listening

November 17, 2017 and March 6, 2018 serve as good examples.
Consequently, we were and still are in a situation when the white metal could either decline sharply right away and move significantly lower or it could move up just a little and then decline sharply anyway. In our opinion, waiting to open a short position for even better prices seems to be a gamble in a game in which the odds are really against us. If we’re about to profit from the $1+ slide in silver, then the possibility of seeing another 10-20 cent upswing while risking missing a 50-cent initial (or so) decline just doesn’t seem to be worth it.
While we’re discussing the above chart, please note that the Stochastic indicator just flashed a sell signal, confirming our analysis.
Gold’s Seemingly Bullish Reversal

What’s particularly interesting is that gold formed a bullish reversal after breaking below the 50-day moving average. Looks familiar? It should as we saw something similar not too long ago - on December 1st, 2017. That was the session that followed the breakdown below the 50-day moving average after the final top. Friday was also the day that followed the breakdown below the 50-day moving average after (what’s likely to have been) the final top.
Single-day analogies are generally not very reliable (more similar cases with a certain outcome are generally needed for the implications to become important), but it’s something worth keeping in mind anyway. Especially that it fits the performance that we often see close to the release of important economic data.
Back on December 1st, gold moved higher, erasing most of its recent short-term downswing, but ended the session only a bit higher, forming a major reversal. If we see something similar in the next few days, gold could move to approximately $1,335 before declining. Again, based on silver’s outperformance, it’s a big “perhaps”.
As a reminder, we expect to see a turnaround based on the very important triangle reversal pattern. We described it in detail on February 26th. To be precise: the turnaround based on the above has likely happened on Friday or is about to take place in the next few trading days. Let’s say that the reversal is highly likely to be seen before the end of Wednesday’s session.
As we emphasized in Friday’s intraday follow-up, the fact that silver moved a few cents above its target level and gold didn’t even move close to it served as a strong bearish sign, as it was a clear sign of silver’s very short-term outperformance – something that often precedes big declines.
Still, we have seen a move back up in gold and a close below the 50-day MA, which makes the session similar to the above-mentioned December 1st, 2017 session. The implications thereof are bearish and they seem to cancel any bullish implications that could result from the reversal itself.
Moreover, please note that just as it is the case in silver, Stochastic based on gold also flashed a sell signal.
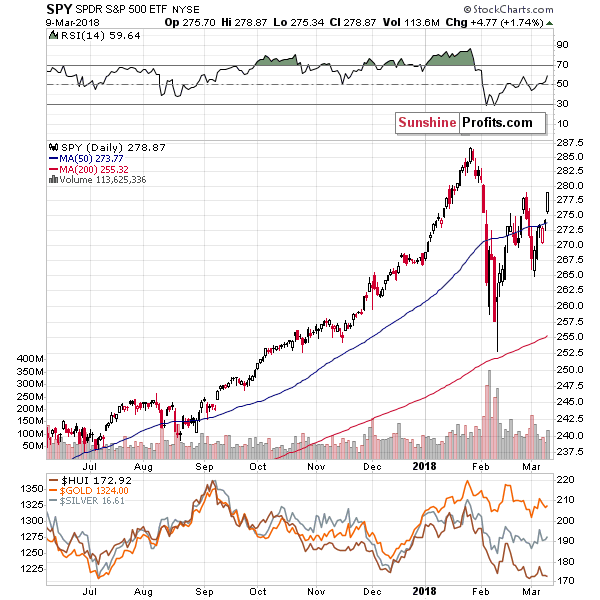
So, gold closed a bit higher and the general stock market moved higher decisively, so one might have expected gold stocks to rally as well. What happened?
Gold Stocks’ Bearish Reversal

The general stock market moved higher on Friday, so some may say that this is the factor behind silver's outperformance, nothing else. If this was the case, mining stocks should have been reacting as well, but they were not.
Assuming that the reason behind silver's and miners' performance was the general stock market, we have lagging mining stocks, which is bearish.
Assuming that the general stock market was not the reason for silver's and miners' performance, we have outperforming silver, which is bearish anyway.
After the closing bell, it turned out that gold mining stocks actually moved lower. There was an initial upswing, but it failed to hold ground despite the strength and the continuation of the rally in the S&P 500. That’s exactly what weakness looks like – miners only had the strength for the initial rally. The buying power was gone before the end of the session and the price fell.
It’s kind of funny to see reversals in both: gold and gold stocks but in the opposite directions. Yet, that’s exactly what we saw and this is another reason not to take gold’s reversal at face value.
The sell signal from the Stochastic indicator is present also in the case of the HUI Index, so it seems that we can view it as confirmed (gold, silver and mining stocks all feature the same signal).
In case you are wondering, the red ellipse on the above chart doesn’t mark the likely short-term target for gold stocks, but the maximum likely one in case we see another small move higher before the bigger slide.
Overall, based on the precious metals’ and mining stocks’ price movement, it seems that we should see much lower values shortly (perhaps even immediately).
The currency sector, however, doesn’t provide crystal-clear indications and it’s something that could postpone the decline.
Two Heads, Four Shoulders, One Uncertainty
The biggest factor determining the prices of precious metals in the near term is usually the USD – after all, how could something move independently from the currency that it’s priced in. This observation is critical as the USD Index itself is in a rather specific place and whichever way the USD Index breaks out/down will determine the next move in the currency and in the precious metals market.

In our previous analyses, we emphasized that the USD Index was above a combination of very strong support levels and the big picture remained bullish. Consequently, the surprises were likely to be to the upside. Thursday’s price action was indeed a surprise to the upside. The USD Index could have declined all the way to our triangle target area, but instead it moved higher sooner. But, does it mean that the final bottom was already formed?

No, there’s still a chance that we’ll see another downswing before the corrective downswing is over. This chance decreased as the jobs report was already released and the uncertainty regarding it is now gone.
Still, let’s keep in mind that a breakdown below the 89.30 level (the red support line), would complete a short-term head-and-shoulders pattern (marked in red) and this would open a way to a move back to the February lows. Technically, it would mean that 87.70 is the next target, but the strength of this technique is much smaller than the strength of the multiple long-term resistance levels that are present around the January and February lows.
Still, on a short-term basis, a move below 89.30 would very likely be followed by a decline to about 88.70 – the declining black support line and the bottom part of our red triangle target area. This is the less likely outcome.
The more likely outcome is the one in which instead of a decline, we see a rally above 91.15 or so (depending on when the USD breaks the rising green resistance line) is likely to be followed by a big rally to almost 94 (to 93.80 or so). This move will be extremely important and it’s not because it will be the first big rally in several months. It will be critical because it will be a crystal-clear sign that the small breakdown below the very long-term declining support / resistance line is invalidated. You can see this line on the below chart:
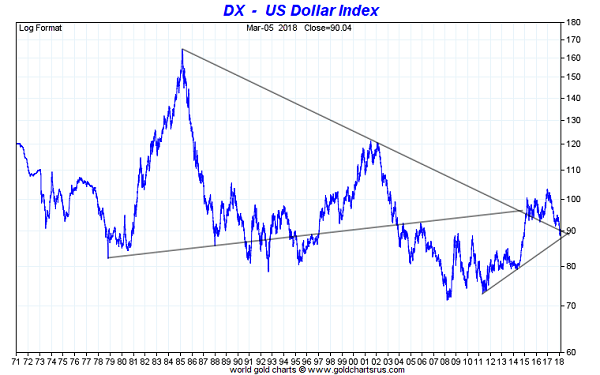
Let’s start the analysis of the very long-term USD picture with the very long-term declining resistance / support line. It served as resistance but was broken in early 2015 and it has served as support since that time. It was touched temporarily and even broken, but all these breakdowns were small and followed by big comebacks shortly. Interestingly, each of the small breakdowns was followed by a bigger upswing than the previous one.
At this time the declining support line is at about 90, which is approximately where the USD is currently trading, so it seems that yet another – perhaps final – verification of the 2015 breakout is in progress.
The implications are already bullish based on the above analogy and they will be extremely bullish once the USD closes visibly above the 90 level for a few weeks in a row, definitely confirming the comeback. That’s what seems very likely to be seen later this month, but not necessarily this week.
What’s just as important, the above USD Index chart features two triangle patterns that are based on the key, long-term, declining support / resistance line. These are the only two triangles that we can really draw (at least the ones that make sense) based on it. One has an apex in the past and one in the future. The apex from the past took place at the key 2014 bottom – it was the bottom that started the huge rally that took the index above 100.
The only time when the triangle apex reversal technique had the chance to prove useful, it did, so we have a good reason to view it’s second indication as very important. After all, it’s based on major long-term highs and major long-term lows.
What does the second apex predict? A very important turnaround a few months before the end of the year.
If the USD is currently verifying a long-term breakout and it’s likely to have an important turnaround in 6 months or so, then we are likely looking at a start of a huge medium-term rally. Naturally, the implications for the precious metals market are bearish for the following months.
Summary
Summing up, a major top in gold, silver and mining stocks is probably in, and based on the way silver and gold stocks performed on Friday, it seems that the big decline is just around the corner. We already saw the key short-term signs: silver’s outperformance and miners’ underperformance on Tuesday, and the fact that they were repeated on Friday makes the bearish outlook even more bearish, especially that our last week’s upside targets for gold and silver were already reached.
********
Przemyslaw Radomski, CFA
Founder, Editor-in-chief, Gold & Silver Fund Manager

Przemyslaw Radomski, CFA, is the founder, owner and the main editor of SunshineProfits.com. You can reach Przemyslaw at: http://www.sunshineprofits.com/help/contact-us/.
More from Gold-Eagle.com:


