Forecasts: History To Repeat In Gold And Dow Index Big Time 2019-2021

History Always Repeats
Last week, trade wars went into high gear, caused by President Trump’s insistence that Mexico stopped illegal immigration from entering US. President Trump further insisted that China stopped intellectual theft and other malpractices according to international rules and laws. This caused severe drops in Dow stock market and a big rise in Gold price.
In this article, we will analyze the big changes coming from historical cycle perspective. The human nature of greed and fear in markets always permeates in history. We conclude that in the period 2019 to 2021, there will be dramatic changes in the fall of Dow index and the rise of the price of Gold.
Expectation for Dow and Gold Prices
We used simple classical pattern analysis for Dow index and Fourier cycle analysis for gold.
Classic Pattern for Dow Index
Chart 1 – Forecast for DOW

The above chart showed:
-
DOW stock index will likely to drop by 40% to 16,000 by 2020 or earlier.
-
The fall in DOW is evidenced by other parameters, especially increasing Volatility.
Forecasts of Gold & Silver
Chart 2 – Fourier Cycle Analysis of Weekly Gold & Silver

We expect a great reset in gold and silver prices first discussed by gold expert Jim Sinclair when the current financial system becomes dysfunctional under tremendous global stress. Our Fourier analysis showed:
-
Gold value of $4000/oz and Silver $100/oz by 2020.
Picture of 20-Year Generational Cycles
Chart 3 – Rise & Fall for Dow, Gold & Silver (1900 – 2020)

The above chart showed the alternate rise and fall of Dow, Gold and Silver from 1900 to current. Note the 20-year alternating periods.
Well Known Historical Cycles by Experts
We included in this article several well-known historical cycles by cycle experts. All seemed to point to the stock market lows in 2020-2021 time frame.
Chart 4 – Benner Cycles & Forecast

Chart 5 – Gann Cycles & Forecast

Chart 6 – Armstrong Cycles & Forecast

Summary
The cycle analyses presented in this article showed that the dramatic and big changes are coming for Dow, Gold and Silver prices. It is important to note that the historical data covered centuries of human investing and trading activities, often similar to what is happening now. We will face turmoil and difficulty in the near future 2019 to 2021. Yet we can prepare for the situation when we know what is likely to happen.
“For God has not given us a spirit of fear, but of power and of love and of a sound mind.” 2 Timothy 1:7
********

The entire precious metals market moved sharply lower yesterday. Silver erased more than it had gained on Wednesday and mining stocks broke below their rising support line. All this happened while gold closed below $1,420 for the first time this week and after it had formed yet another weekly reversal. Can the precious metals continue to rally regardless of all the above? They can, but…
…They are very unlikely to. The above combination of factors is already very powerful, but it’s additionally strengthened by other trading factors, i.a. the breakout above the inverse head-and-shoulders formation in the USD Index and the downtrend in the gold stocks to gold ratio.
Let’s take a closer look for details, starting with the outlook for the USD Index.
The USD Index Digests Recent Gains
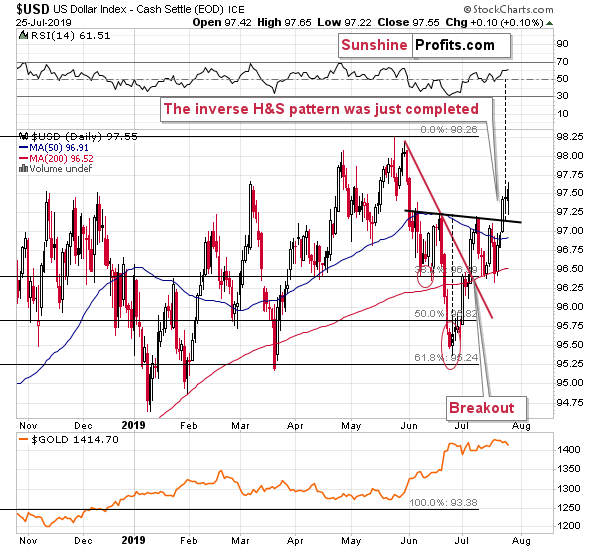
We previously commented on the USD Index by describing the possible (!) implications of the potential (!) pattern that might have been forming. Until a given pattern is completed, it has practically no direct implications. If it was any other way, a partial pattern would itself become a pattern (a.k.a. formation) with its own name and implications.
What we saw on Tuesday was a decisive breakout above the neck level of the inverse head-and-shoulders pattern, which means that the short-term outlook for the USD Index just improved in a major way. The rally that follows this kind of formation is likely to be at least as big as the size of the head. We marked it with the vertical, dashed line. Yes, it implies a move well above the previous 2019 high.
Initially, it seemed that the precious metals investors were not "buying it" yet. The dollar failed to break to new highs many times, so many people were assuming that it will fail once again. However, the inverse H&S pattern tells us that this time it's actually going to soar through the previous highs. This will likely be a big surprise for the PM investors and when people are surprised, they act quickly. This time, the reaction will likely be driven by fear, which will probably make it particularly volatile.
Gold moved higher recently, but it failed to rally above the late-2013 high - it invalidated the initial breakout. Invalidations of breakouts are usually followed by sizable declines, and the current situation in the USD Index perfectly fits this scenario for gold.
The USD Index just confirmed its breakout by closing above the neck level for third consecutive day and all the implications described above are even stronger. The noteworthy thing is the precious metals’ reaction to the USD breakout. We wrote that the investors were not “buying it”, but it seems that has started to change yesterday. The USD was up rather insignificantly (just 0.10), while gold declined in a more visible way (almost $10).
PMs Reflect the USD Index Breakout

While gold declined, silver declined more, and mining stocks closed at the week’s lowest level. This is not very significant by itself, but the breakdown below the rising support line is. The line is based on the intraday lows and the breakdown was confirmed by the closing price. If the line was drawn using the closing prices, the breakdown would be much clearer. Either way, it will need to be confirmed for the implications to become stronger. The odds are that it will be confirmed shortly i.a. due to the USD Index outlook.
Speaking of gold mining companies, let’s check how they performed relative to gold. We’re going to use the HUI as a mining stock index due to its popularity, wide data availability and the fact that it focuses practically solely on gold miners.
Miners to Gold Ratio Still in a Downtrend

The HUI ratio to gold soared in the last couple of weeks, but it generally remains within the broader downtrend. The ratio is just a little above the low that it reached in 2000 and significantly below the 2008 low. The downtrend that started in 2004 remains intact up to this day. Naturally, gold miners usually outperform gold on a short-term basis, but since they also multiply gold’s moves on the downside, the miners don’t have to provide the bigger bang for the buck compared to the buck invested in gold itself. At least not in the long run.
Technically, we see that the ratio moved just a little above the declining resistance line that’s based on the 2011 and 2016 highs. This breakout would need a confirmation in order to be really bullish and given all that we wrote above, it seems very unlikely that it will be confirmed. What is likely, is that this tiny breakout will be invalidated, and invalidations of breakouts are strong sell signs. The follow-up action is not likely to be a major rally. It’s likely to be a sizable slide, just like the one that we saw in 2011 or 2016.
Some may say that the recent rally is a bullish sign that indicates that there will be no bigger move lower. Please note that it has already happened. The sharpest slide of the past two decades took place in 2008 and this decline was preceded by a sharp rally.
What does it mean? It means that the mining stock relative valuations can get even more ridiculous than they were in late 2015 and early 2016.
Let’s get back to gold and zoom out to make sure we see the forest, not just the trees.
Broader Check On Gold

While the daily closing prices are important, the weekly closing prices and weekly price changes are even more so. We previously commented on the very bearish implications of the shooting star in gold as it was accompanied by huge volume and these indications were just confirmed by yet another analogous reversal. Last week’s reversal was also accompanied by huge volume so we clearly see that gold bulls are being overpowered here.
It's also important to keep the price level in mind. It’s the late-2013 high that gold tried to break above. Gold’s inability to hold its gains and the quick invalidation of all attempts to breach the late-2013 high serve as a strong bearish indication.
The RSI above 70 says that gold is overbought from the medium-term point of view (in terms of weeks) - and both reversals clearly confirm that the rally is over.
Summary
Summing up, the short-, medium-, and long-term indications point to lower precious metals’ prices in the following weeks and months. We know that these are not pleasant times for anyone who refuses to jump on the bullish bandwagon just because prices are moving higher, but what’s profitable is rarely the thing that feels good initially. The relative strength in the silver market is a factor that’s beyond bearish, while the previous strength in gold stocks appears just as misleading as their weakness was back in early 2016. Gold has just invalidated its breakout above the previous highs, the late-2013 highs, and the upper border of the pennant pattern, which is a very strong bearish sign. The situation in the currency market confirms the bearish outlook for the PMs. In those circumstances, we simply cannot forecast higher gold price in the medium term. There will most likely be times when gold is trading well above the 2011 highs, but they are unlikely to be seen without being preceded by a sharp drop first.
Naturally, the above is up-to-date at the moment of publishing and the situation may – and is likely to – change in the future. If you’d like to receive follow-ups to the above analysis, we invite you to sign up to our gold trading newsletter. You’ll receive our articles for free and if you don’t like them, you can unsubscribe in just a few seconds. Sign up today.
Przemyslaw Radomski, CFA
Editor-in-chief, Gold & Silver Fund Manager
Sunshine Profits - Effective Investments through Diligence and Care
* * * * *
All essays, research and information found above represent analyses and opinions of Przemyslaw Radomski, CFA and Sunshine Profits' associates only. As such, it may prove wrong and be a subject to change without notice. Opinions and analyses were based on data available to authors of respective essays at the time of writing. Although the information provided above is based on careful research and sources that are believed to be accurate, Przemyslaw Radomski, CFA and his associates do not guarantee the accuracy or thoroughness of the data or information reported. The opinions published above are neither an offer nor a recommendation to purchase or sell any securities. Mr. Radomski is not a Registered Securities Advisor. By reading Przemyslaw Radomski's, CFA reports you fully agree that he will not be held responsible or liable for any decisions you make regarding any information provided in these reports. Investing, trading and speculation in any financial markets may involve high risk of loss. Przemyslaw Radomski, CFA, Sunshine Profits' employees and affiliates as well as members of their families may have a short or long position in any securities, including those mentioned in any of the reports or essays, and may make additional purchases and/or sales of those securities without notice.
*********
Gold-Eagle provides regular commentary and analysis of gold, precious metals and the economy. Be the first to be informed by signing up for our free email newsletter.
More from Gold-Eagle.com:


