Gold Cycles Turning Higher

Gold saw its low for last week made in Monday's session, here doing so with the tag of the 1188.10 figure. From there, strength was seen into a Wednesday high of 1212.30 - before backing slightly off the same to end the week.
With the action seen last week, the probabilities now favor our 34-day cycle to have troughed with the recent tag of the 1184.30 - and with that to be headed higher off the same in the coming weeks, due to a low-end statistical inference in regards to this component:

Just how high the upward phase of the 34-day wave will carry is still speculation at this point, though a low-end statistical analysis of price suggests a potential push up to the 1236-1260 level (December, 2018 contract), before peaking the larger 72-day cycle, which has been deemed to be pointing higher off the 1167 swing bottom:

Going further with the above, the move up with the 34 and 72-day cycles looks like it will end up as a larger ABC pattern within Elliott wave, and, once complete, the metal is likely to see a drop back to or below the 1167 swing bottom on the next downward phase of the 72-day component.
Stepping back, there has been speculation as to whether the 1167 swing low would end up as a bottom for the larger 154 and 310-day cycles, mainly due to the configuration of our Gold Timing Index - which will normally diverge (and issue a buy signal) prior to 310-day type bottoms. Either way, our key dividing line with these two waves has been the 1263.50 figure (December, 2018 contract) on a close:

With the prior comments then, it looks like the upward phase of the smaller 34 and 72-day cycles has the potential to test the upside ‘reversal point’ for the bigger 154 and 310-day cycles. If the metal is able to close above the 1263.50 figure on a close, then the probabilities would favor additional strength on up to the 310-day moving average or higher.
U.S. Stock Market
As mentioned last weekend, the U.S. stock market looked like it had peaked short-term - and with that was headed on down to the 2860-2880 level for the SPX CASH, which we did see with last week's sharp decline:

With the above said and noted, more key to the mid-term picture here is the 2863.00 number for the SPX, which is our current dividing line between up and downward phasing of the larger 180 and 360-day cycles - the combination of which are looking for the next mid-term trough around the Autumn of this year.
For the very short-term, it looks like Friday's low of 2869 SPX CASH has the potential to trough the smaller 10-day cycle for a rally attempt into the new trading week:
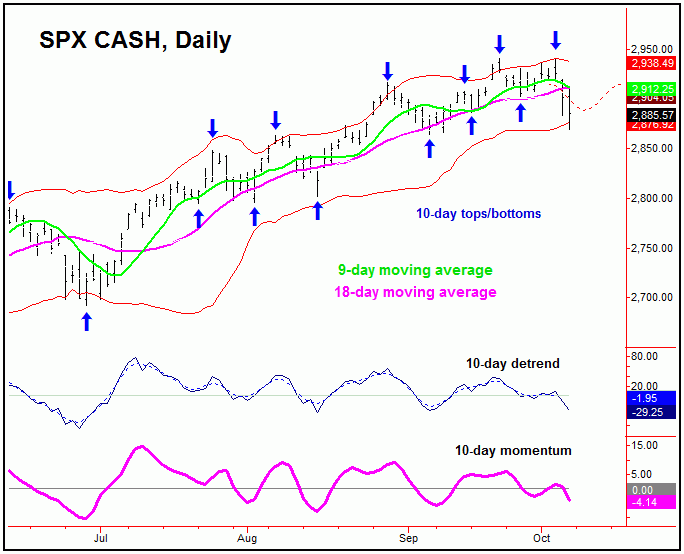
Otherwise, if I am wrong on the above - and a lower low should still be out there for the 10-day cycle in stocks - then firm support would be at or into the 2850-2860 region, and, if tested, would be expected to give way to a decent short-term rally with this cycle. As we head into the new week, I am looking for a minimum rally back to the 9-day moving average or higher.
Mid-Term For Stocks
For the mid-term picture, as noted above (and in past articles) the next larger trough for the SPX is due around the autumn of this year. In terms of price, the ideal path would favor a drop back to the 200-day moving average, though with the potential for a decline all the way back to the 360-day moving average before these waves bottom:

Stepping back further, however, the probabilities do favor the next correction phase of the 180 and 360-day cycles to end up as a countertrend affair - which means the SPX should remain above the February, 2018 trough of 2532.69. If correct, the next upward phase of these waves should take the SPX back to or above the highs again into what is looking to be late-2018 and/or the spring of 2019. From there, however, the probabilities will strongly favor the four-year cycle to start rolling over for a decline of 30% or more off the top. Stay tuned.
Jim Curry
The Gold Wave Trader
http://goldwavetrader.com
http://cyclewave.homestead.com
********
Gold-Eagle provides regular commentary and analysis of gold, precious metals and the economy. Be the first to be informed by signing up for our free email newsletter.
More from Gold-Eagle.com:


