Gold Forecast: Gold Cycle And Stock Market Updates

Last week's trading saw gold forming its high for the week in Tuesday's session, here doing so with the tag of the 1503.00 figure. From there, weakness was seen into Wednesday's session, with the metal dropping down to a low of 1480.30 - before consolidating to the upside to end the week.
Gold, Short-Term
For the very short-term, the downward phase of the 10-day cycle has been in force over the past week, with the next short-term low expected to come from this wave. In terms of time, it is at or into bottoming territory, and could well have already seen its low with the recent tag of the 1478.00 figure, though the metal would need to see a push above the 1505.00 figure (December, 2019 contract) to actually confirm that assessment. Here is the chart of our 10-day wave:

With the above said and noted, any reversal back above the 1505.00 figure - if seen - would be our best indication that the next upward phase of the 10-day cycle is back in force. In terms of time, that action would favor additional strength into early-to-mid week, this week.
Stepping back slightly, the key is whether the next 10-day upward phase will have enough 'oomph' to trigger a reversal higher with the larger 72-day wave. We have a key number that - if taken out to the upside - would be our best indication that this larger cycle has turned higher. That number has yet to be reversed above, and thus the metal will remain weaker below it. Here again is our 72-day component:
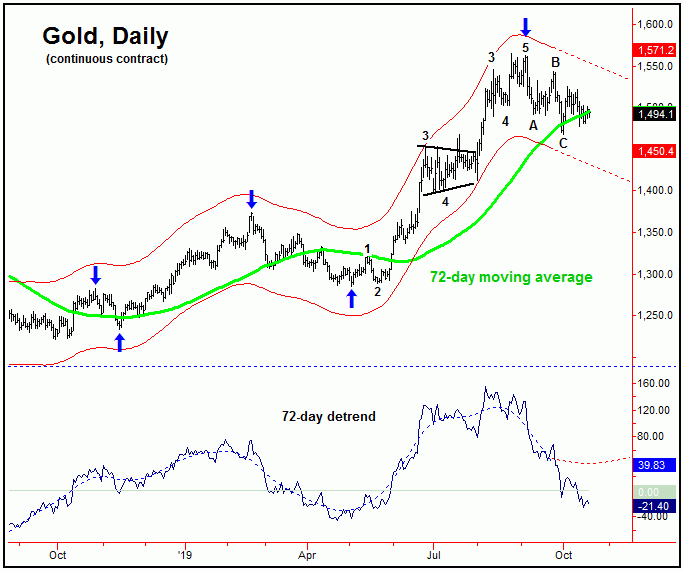
From the comments made over the past few months, the last good correction phase was expected to come from this 72-day cycle, which was projected to peak back in August - and was then expected to trough around the late-September to early-October timeframe. In our Gold Wave Trader report, our key date range was September 27th - October 4th, with the actual low coming in on October 1st - right in this projected window.
In terms of price, the 72-day moving average was the expected minimum correction for this 72-day component, which was also met. In terms of patterns, the move was projected to end up as a countertrend, or ABC correction in Elliott-wave, which - at least thus far - has been the case. We are now awaiting confirmation for an upturn with this component, which, if seen, should give way to additional strength in the coming months.
Gold's Mid-Term Picture
Stepping back, the mid-term picture for gold is looking for the next upward phase of the 72-day cycle to top the larger 310-day wave, with that cycle shown again in the chart below:

The 310-day cycle last bottomed back in August of 2018, and - as you can see on our chart - is projecting lower into the Spring of next year. There is actually some potential that this wave has already topped - due to the commercial short interest - though the preferred path is for it to peak with the next upward phase of the 72-day cycle. If the upward phase of this 72-day wave is triggered to be back in force, we have an exact date that we are looking for this 310-day peak to materialize.
Otherwise, as mentioned last weekend, if gold has not seen its bottom for the 72-day cycle downward phase, then key support is again noted at the 1425-1458 level (December, 2019 contract), which is the 38-50% retracement of the swing up from the May trough to the early-September peak.
For the bigger picture, from whatever peak that forms with the 310-day cycle, we should see the largest percentage correction since the decline into the August, 2018 bottom. In terms of price, that decline should see the 310-day moving average acting as the minimum magnet, but with the obvious potential for additional weakness through the same. In terms of patterns, however, that move IS expected to end up as a countertrend affair, holding above that August, 2018 price bottom.
Commercial Hedgers
In looking at the latest numbers from the CFTC, the commercial hedgers have covered around 22,000 of their recent short positions, which drops their current net short (bearish) total down to some -288,275 contracts - with the data current to the 10/14/19 close. Here is our chart:

I have mentioned in past articles that gold's biggest technical problem going forward is the large short position held by the commercial hedgers. That is, the hedgers were just recently short their largest position since the July, 2016 price top - which was the last major peak for gold. Basically, they are positioned for a larger decline - which we know should come from our 310-day cycle. Whether that wave has peaked is speculation, though the ideal path would favor it to come on the next rally phase of the 72-day cycle.
U.S. Stock Market
From the comments made in past articles, the 45-day cycle was expected to correct lower into what was projected to be the early-October timeframe. The actual low came in on October 3rd, doing so with the tag of the 2855.94 SPX CASH figure. Here is that 45-day wave:

In terms of patterns, the decline into the 45-day trough was expected to end up as countertrend - against the August low of 2822.12 on the SPX. That also ended up as correct, and with that the current upward phase of this wave is favored to take the index back above the 3021.99 and 3027.98 swing tops in the coming weeks, then to set up a peak with our next larger cycle, the 90-day component, which is shown below:

Stepping back then, the ideal path favors higher highs in the coming weeks, then to set up for a correction with our 90-day cycle. That decline would be favored to end up as another countertrend affair - holding above the 2855.94 low that we just saw. From there, higher highs should continue to play out into next year, where we are looking for the next major price top to form. This is key, as - following that major top - stocks are likely to see a decline of 30-40% off the top, as the next bear market unfolds.
Going further with the above, there are key technical indications that we are watching, that should alert us to the next major top in stocks. For now, however, these technical signals have yet to materialize, and with that the assumption that higher prices will continue to play out in the coming months. Right now, playing the market defensively is the proper strategy, keeping in mind that we are in a very late stage bull market - one that could really turn at anytime in the coming months. More on all as we continue to move forward.
Jim Curry
The Gold Wave Trader
http://goldwavetrader.com/
http://cyclewave.homestead.com/
*********
Gold-Eagle provides regular commentary and analysis of gold, precious metals and the economy. Be the first to be informed by signing up for our free email newsletter.
More from Gold-Eagle.com:


