The Writing Is On The Wall
Here’s a BEV chart for the Dow Jones going back to January 1982. The BEV plot fell to its -25% line (Dow Jones 777) in August 1982. This was a historic bottom; after it nothing would ever be the same again for the stock market. Since 1966 the Dow Jones on five occasions attempted to break above, and stay above 1000, only to fail every time. People were sick of the stock market. For two decades “making money” and “stock market” were terms few had any reason to use in the same sentence.

All that was going to change, though no one knew that in August 1982; still the writing was on the wall. Bond yields peaked in October 1981. After a thirty year bear market in fixed income, bond prices were trending upward (and bond yields downward) for the first time since the early 1950s. But after thirty years of rising yields and falling prices no one believed these new trends in the bond market would last long, or that the stock market would also benefit from these new developments.
They soon would, as evident in the frequency distribution table below of the BEV data seen above from August 1982 to January 2000 (right table). I also included the frequency distribution (left table) for the BEV data of the eighteen years prior to August 1982 as a comparison, the time when a 1000 on the Dow Jones became an impossible dream.
Out of 4,406 NYSE trading sessions (right side), the Dow Jones made 477 new all-time highs (10.83%), and those trading sessions closing not at new all-time highs, 2,530 (57.42%) closed within 5% of one. From August 1982 to January 2000 the Dow Jones closed more than 10% from a BEV Zero on only 15.57% of these trading sessions.
However, in August 1982 investor’s expectation of the market is found in the table on the left. So, due to people’s personal experience with the stock market from 1965 to 1982, they had no reason to believe such a massive bull market was possible.

This is how people are; creatures of habit believing market trends of their eras are permanent fixtures in the economy. But the history of the market is one of change. I expect people today will be as slow accepting the coming shifts in the market’s tectonic plates as they were in 1982. Yet once again the writing is on the wall.
For one thing, a HUGE THING, the monster bull market in bonds concluded in the summer of 2016. Bond yields have done nothing but trend upward (and bond prices drift down) since. Here’s a 30yr T-bond issued in August 1997, it currently has nine years before it must be rolled over. It was issued with a 6.375% coupon (Red Plot), but two years ago its current yield fell below 1.5%; two years later at the close of this week its yield was over 3.0%.
For Uncle Sam and his $21.7 trillion in these IOUs, this is a huge move in yields. What’s every one’s favorite uncle going to do when yields rise to over 5% and debt service becomes the largest item on the US Treasury’s annual budget?
What’s Wall Street going to do when tens of trillions of fraudulent interest-rate derivatives come into the money because of rising bond yields? The NYSE will be as chaotic as it was at the height of the sub-prime mortgage crisis. Most likely the chaos will be worse as this time the scale of fraud being exposed is even greater. That and the ability for the US Treasury and Federal Reserve to respond in favor of Wall Street’s big banks greatly hampered.

Mortgage rates are going up too. What that will mean for the real-estate market can be seen in the table at the upper right. Using a $1,000 a month payment on a 30yr mortgage, it’s apparent why real estate had a huge bull market from 1981 to 2012. As rates declined from 18% down to 2.5% - a $1,000 a month payment could, and did qualify for an ever larger mortgage for existing housing and new home construction.
However, with rising mortgage rates this engine of inflation is going to go into full reverse and become an engine of deflation in the real estate market. A real estate crisis wasn’t bullish for the stock market in 2007-09, and won’t be in the next crisis either.

The only class of fixed income whose yields aren’t rising seems to be municipal bonds (Blue Plot below). Since November 2010 best grade corporate bonds offered lower yields than muni bonds, but due to rising corporate bond yields, this anomaly in the bond market is coming to an end after 394 weeks. Why isn’t the muni-bond market pricing in the pending pension-fund crisis for state and local government?
With so many of the baby-boomer generation approaching retirement age – the muni-bond market will soon be forced too, and yields for even best grade muni bonds will rise to levels few believe possible today.
Here’s the Chicago Fed’s draconian solution to the city of Chicago’s pending pension crisis. With these people, the average person is only a human resource to be managed to the best advantage of the state. Obviously they believe the little people should only own what their betters allow them to have – which won’t be much should they ever have their way with us.
https://www.oathkeepers.org/chicago-fed-thinks-knows-tax-illinoisans-fleeing-pension-liabilities/

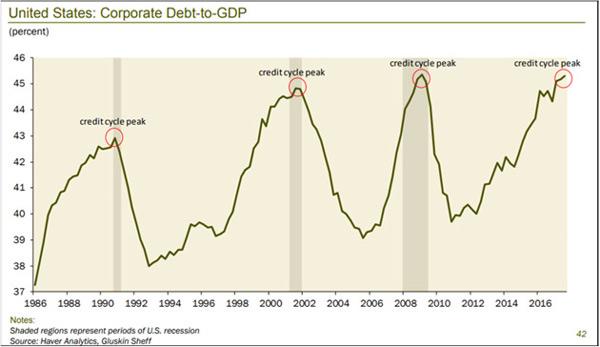
Here’s a chart a good friend and devoted follower of my market commentary sent me; it’s a ratio of corporate debt / GDP. Following each “credit cycle peak” in the chart, the American economy and stock market saw increasingly larger difficulties. The last credit peak (2007-09) almost took down the entire global financial system. Ten years later should we believe “this time is different?”
The source of all this corporate debt ultimately is the banking system, and the banks aren’t doing all that good either. I have a BEV chart of the banks below. From 1938 to 1988 the data is from the now discontinued Barron’s Stocks Averages. After October 1988 I used the banking group from the Dow Jones Total Market Groups to continue the series.
Before August 1971 the banks never saw a 40% decline. As is painfully evident below, that wasn’t true after 1971 when their credit creation was freed from the confines of the Bretton Woods $35 gold peg. During the sub-prime mortgage crisis these banks saw a decline of Great Depression proportions as they choked on their own waste from their “structured finance” scams in the mortgage market.

These financial companies have received trillions in direct and indirect assistance from the Federal Government and Federal Reserve since 2007, yet they’ve failed to fully recover to their pre credit crisis highs. How can that be good? These institutions are Wall Street. If they fail in the coming crisis, overwhelmed by a tsunami of counter party failure as tens of trillions of interest rate derivatives come into the money that they can’t honor, where does that leave the Dow Jones?
It seems trivial after considering the chart above, but like bond yields, the price of oil below bottomed in the summer of 2016. Is there a connection here? Maybe. In any case, seeing the price of oil approaching $100 isn’t bullish for the stock market.

My point with all this is how from the early 1980s, to just two years ago, the markets enjoyed a huge tail-wind as rates and bond yields declined for four decades. With these trends in yields bottoming, then reversing two years ago, its only matter of time before stocks and bonds once again become less than desirable assets to buy and hold. The last time that was true, gold, silver and the mining shares were the places to be.
Though I admit it, in May 2018 this currently isn’t the case. Look at the volatility in the Dow Jones below, in the past two weeks the stock market has regained its composure. As the Dow Jones is only about 7% from taking out it last all-time highs, I can’t rule out that sometime this summer it may just do so.

The top 20 in the DJTMG saw 51 of the 74 groups in the sample closing this week within 20% of their last all-time highs. But is this really bullish? Since 1992 it wasn’t the other times the top 20 found itself at a peak. I’d say what we’re seeing below is yet more writing on the wall.

This week gold declined below $1300. But in its BEV chart below it’s still holding above its rising trend line. Three times before gold threatened to break below it, only to ultimately bounce off and rise to higher levels. Will gold do this for a fourth time? Maybe, and then maybe not. In either case, after gold’s hard bottom of December 2015, I don’t lose sleep worrying about gold entering a new round of catastrophic price collapse seen in the chart from 2011 to 2015.

In gold’s price and step sum chart below the decline below $1300 appears more serious than in its BEV chart above. But so far the bears have failed to get gold to break below the rising trend line.
Listen, I’m sick of all this bogus market action in the gold and silver markets. Left to its own, free from the massive waves of short selling tons of phantom metal at the COMEX, gold would have risen above $2000, and kept going up years ago. But we have to play the game using the cards dealt to us, and considering everything, I’m very bullish on gold and silver.
So the bad guys are doing it again; pushing down the price of gold. Okay, let’s see what they can do? If they can’t drive gold down below the $1125 line below, it’s only because they are weak. If they can’t get it below the $1225 line, it’s because they are even weaker than I think they are. If they can’t break the price of gold below its rising trend line in the chart – I’ll laugh at them for just being pathetic.

Here’s the step sum chart for the Dow Jones. It’s looking good. The rising step sum plot (Red Plot) shows market sentiment is positive; that new highs in the Dow Jones are anticipated by the bulls. The only thing left is for the Dow Jones to do is to make that happen, but will it?
Like me, my readers are just going to have to wait to see how this works out. But I’m cheering for the bulls. Why not one more frolicking advance up the grassy slope before the cattle trucks arrive to take the whole lot of them to the meat packing facility? Or am I wrong here, that in fact the next nine years will bring another 20,000 or more points to the Dow Jones. Best we keep a sharp eye out for those cattle trucks just in case.

Gold and the Dow Jones’ step sum tables are next. The Dow Jones’ table tells us the bulls on Wall Street are fat, dumb and happy. Not much more to say about that. But the gold market has seen heavy selling pressure in the past twenty-five trading sessions.
Since April 16th its step sum is down by a net of six down days, that’s a lot. And since May 1st its 15 count has been either a -3 or -5. Look at all that RED. Considering everything, I’m not surprised gold has lost $56 in the past twenty-five trading days. What’s surprising is it hasn’t lost even more under this massive selling pressure.
This has happened before, on a more massive level. Look at the bull box in the chart below. For three years gold’s step sum (Red Plot) declined as down days overwhelmed advancing days. Yet for all this selling the price of gold did little. It wasn’t going up. We had to wait for 2001 for that. But inside the bull box the price of gold didn’t collapse either.
That’s very typical of market bottoms, where the bears, trying with all their might just can’t get an asset’s valuation to decline as they would like it too. Keep this in mind as we see the price of gold today not really cooperating with the bears. In these situations, there always comes a point where the bears become exhausted, and that’s when the market reverses to the favor of the bulls. We’ll get there.

Looking at this twenty year step-sum chart for gold, I don’t feel the need to justify my bullish expectations for gold in the years to come. This is especially so two and a half years after the December 2015 bottom, and the seven years after gold’s last all-time high. Any speculative excesses in the gold market were purged years ago. The good Lord willing, I expect 2018 will ultimately prove to be a great year for gold and silver.
Publishing note: I’m taking the next two weeks off. Sorry, but now and then I need a break. My next article will be out the weekend of June 8-10. Until then, remember to pray for President Trump. You do realize that Hillary wasn’t supposed to lose – but she did, leaving the establishment exposed for all their criminal activities of the past few decades. As a follower of the Q posts, Trump is closing in on the Obama / Clinton gang, and we might see some excitement in the weeks to come.
They hate him. They’d murder him if they could, so I’m all for him, warts and all. So, if you’re so inclined take a moment of your time and ask the Lord to protect our President and the United States. If you like, pray for Canada too and may Gold save the Queen, the European Union and you fill in the blank __________. From what Q has been saying – there are very dark forces at work in the world, so they really need our prayers.
Mark J. Lundeen
More from Gold-Eagle.com:


